Chippewa vs U.S. Virgin Islander Female Poverty Among 25-34 Year Olds
COMPARE
Chippewa
U.S. Virgin Islander
Female Poverty Among 25-34 Year Olds
Female Poverty Among 25-34 Year Olds Comparison
Chippewa
U.S. Virgin Islanders
18.0%
FEMALE POVERTY AMONG 25-34 YEAR OLDS
0.0/ 100
METRIC RATING
320th/ 347
METRIC RANK
16.7%
FEMALE POVERTY AMONG 25-34 YEAR OLDS
0.0/ 100
METRIC RATING
300th/ 347
METRIC RANK
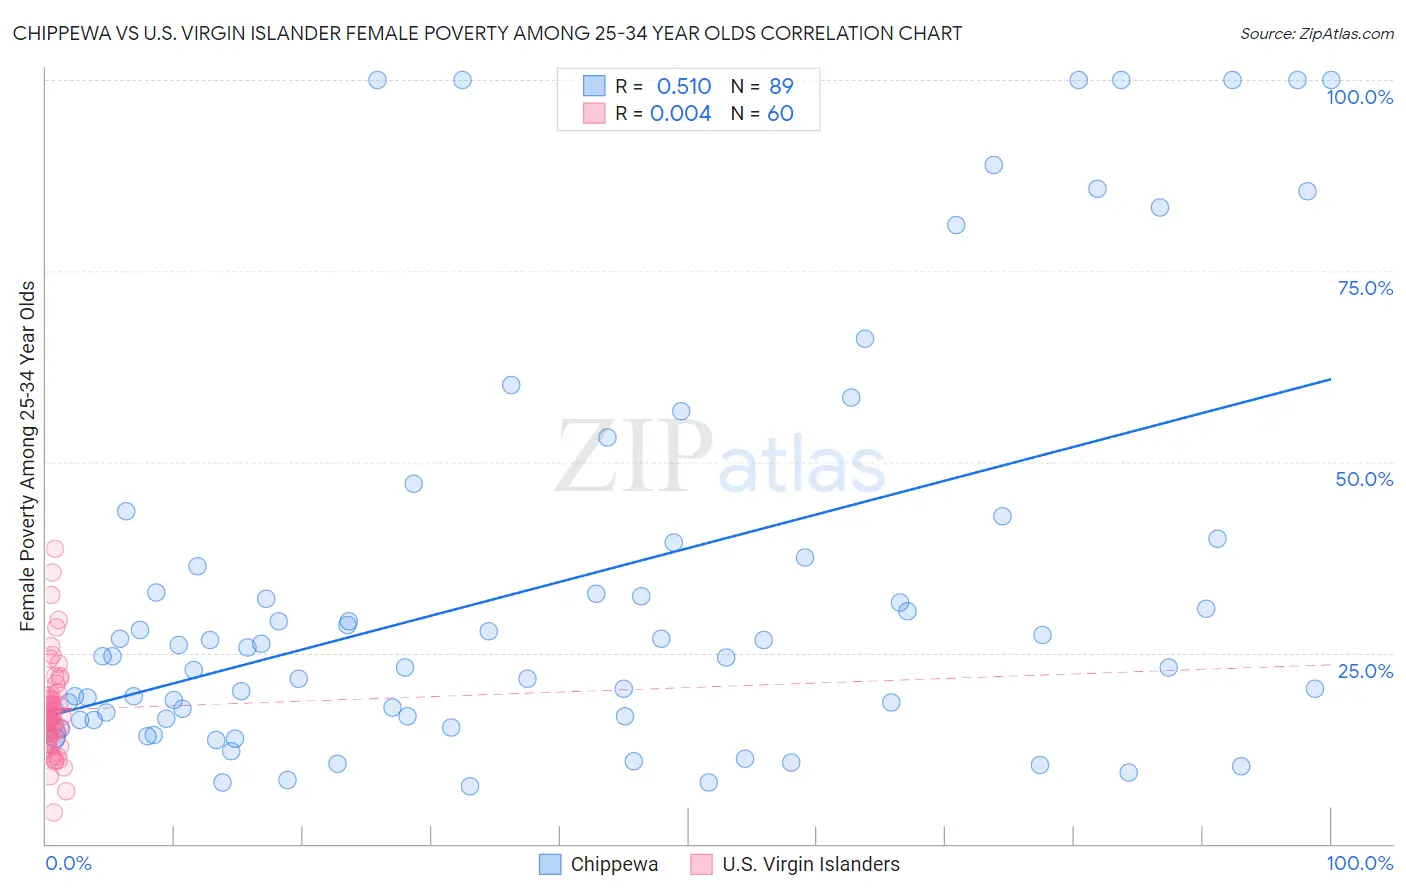
Chippewa vs U.S. Virgin Islander Female Poverty Among 25-34 Year Olds Correlation Chart
The statistical analysis conducted on geographies consisting of 213,001,722 people shows a substantial positive correlation between the proportion of Chippewa and poverty level among females between the ages 25 and 34 in the United States with a correlation coefficient (R) of 0.510 and weighted average of 18.0%. Similarly, the statistical analysis conducted on geographies consisting of 87,236,206 people shows no correlation between the proportion of U.S. Virgin Islanders and poverty level among females between the ages 25 and 34 in the United States with a correlation coefficient (R) of 0.004 and weighted average of 16.7%, a difference of 7.6%.
Female Poverty Among 25-34 Year Olds Correlation Summary
| Measurement | Chippewa | U.S. Virgin Islander |
| Minimum | 7.5% | 4.1% |
| Maximum | 100.0% | 38.7% |
| Range | 92.5% | 34.6% |
| Mean | 33.8% | 17.5% |
| Median | 24.5% | 16.3% |
| Interquartile 25% (IQ1) | 16.3% | 14.2% |
| Interquartile 75% (IQ3) | 38.5% | 19.4% |
| Interquartile Range (IQR) | 22.2% | 5.2% |
| Standard Deviation (Sample) | 26.8% | 6.3% |
| Standard Deviation (Population) | 26.6% | 6.3% |
Demographics Similar to Chippewa and U.S. Virgin Islanders by Female Poverty Among 25-34 Year Olds
In terms of female poverty among 25-34 year olds, the demographic groups most similar to Chippewa are Menominee (18.0%, a difference of 0.26%), Ute (17.9%, a difference of 0.81%), Arapaho (17.8%, a difference of 1.4%), Yakama (17.6%, a difference of 2.2%), and Dominican (17.6%, a difference of 2.2%). Similarly, the demographic groups most similar to U.S. Virgin Islanders are Immigrants from Congo (16.7%, a difference of 0.010%), Alaska Native (16.8%, a difference of 0.12%), Immigrants from Mexico (16.8%, a difference of 0.44%), Honduran (16.9%, a difference of 0.86%), and Immigrants from Cabo Verde (16.9%, a difference of 1.0%).
| Demographics | Rating | Rank | Female Poverty Among 25-34 Year Olds |
| U.S. Virgin Islanders | 0.0 /100 | #300 | Tragic 16.7% |
| Immigrants | Congo | 0.0 /100 | #301 | Tragic 16.7% |
| Alaska Natives | 0.0 /100 | #302 | Tragic 16.8% |
| Immigrants | Mexico | 0.0 /100 | #303 | Tragic 16.8% |
| Hondurans | 0.0 /100 | #304 | Tragic 16.9% |
| Immigrants | Cabo Verde | 0.0 /100 | #305 | Tragic 16.9% |
| Chickasaw | 0.0 /100 | #306 | Tragic 17.0% |
| Yaqui | 0.0 /100 | #307 | Tragic 17.0% |
| Africans | 0.0 /100 | #308 | Tragic 17.0% |
| Ottawa | 0.0 /100 | #309 | Tragic 17.1% |
| Cherokee | 0.0 /100 | #310 | Tragic 17.2% |
| Immigrants | Honduras | 0.0 /100 | #311 | Tragic 17.3% |
| Iroquois | 0.0 /100 | #312 | Tragic 17.5% |
| Colville | 0.0 /100 | #313 | Tragic 17.5% |
| Immigrants | Dominican Republic | 0.0 /100 | #314 | Tragic 17.6% |
| Yakama | 0.0 /100 | #315 | Tragic 17.6% |
| Dominicans | 0.0 /100 | #316 | Tragic 17.6% |
| Arapaho | 0.0 /100 | #317 | Tragic 17.8% |
| Ute | 0.0 /100 | #318 | Tragic 17.9% |
| Menominee | 0.0 /100 | #319 | Tragic 18.0% |
| Chippewa | 0.0 /100 | #320 | Tragic 18.0% |