Subsaharan African vs South African Single Mother Poverty
COMPARE
Subsaharan African
South African
Single Mother Poverty
Single Mother Poverty Comparison
Sub-Saharan Africans
South Africans
31.4%
SINGLE MOTHER POVERTY
0.2/ 100
METRIC RATING
266th/ 347
METRIC RANK
28.5%
SINGLE MOTHER POVERTY
86.6/ 100
METRIC RATING
142nd/ 347
METRIC RANK
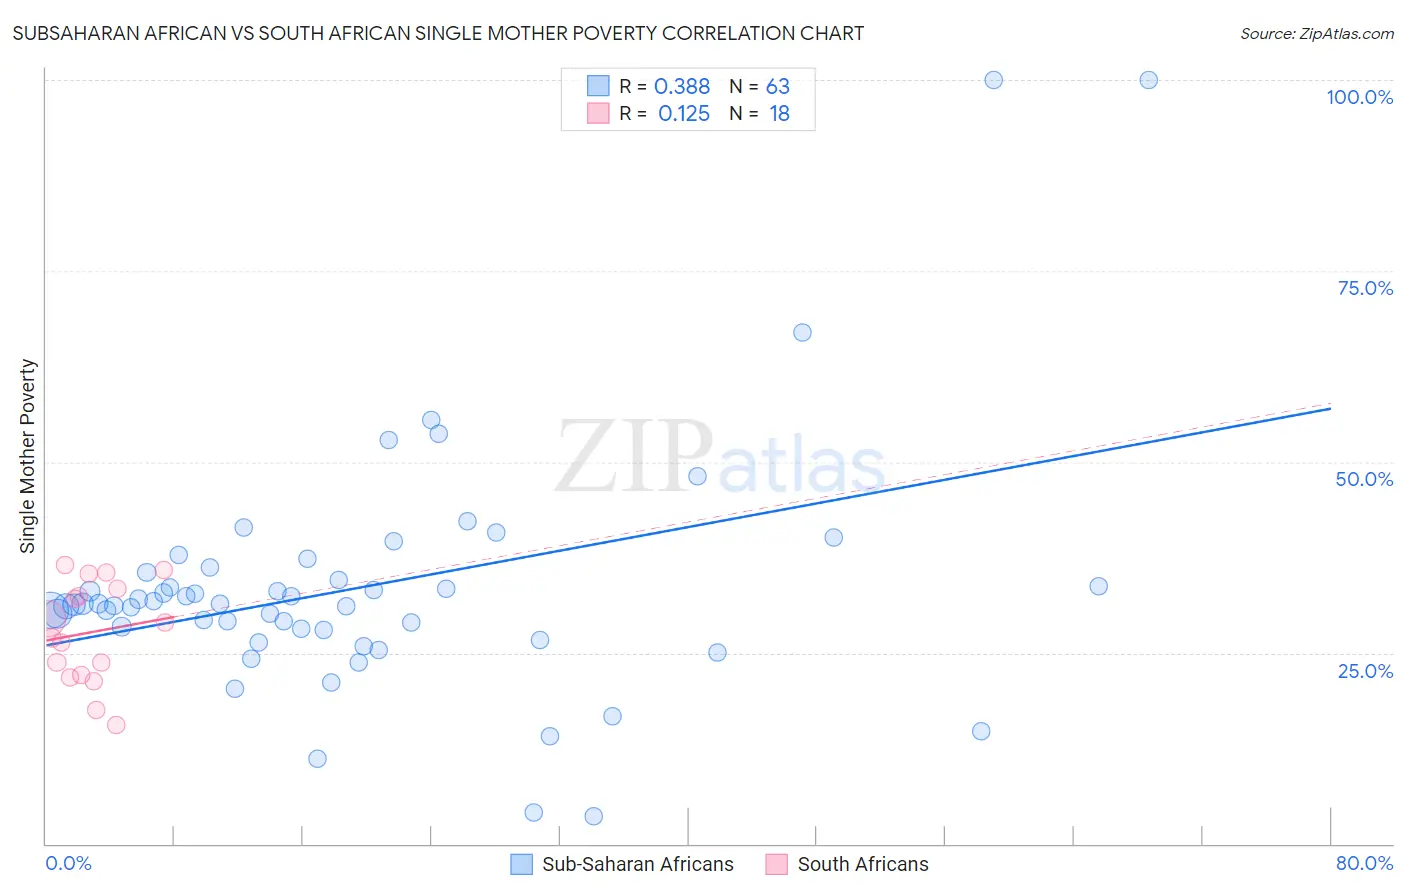
Subsaharan African vs South African Single Mother Poverty Correlation Chart
The statistical analysis conducted on geographies consisting of 493,508,844 people shows a mild positive correlation between the proportion of Sub-Saharan Africans and poverty level among single mothers in the United States with a correlation coefficient (R) of 0.388 and weighted average of 31.4%. Similarly, the statistical analysis conducted on geographies consisting of 179,638,644 people shows a poor positive correlation between the proportion of South Africans and poverty level among single mothers in the United States with a correlation coefficient (R) of 0.125 and weighted average of 28.5%, a difference of 10.0%.
Single Mother Poverty Correlation Summary
| Measurement | Subsaharan African | South African |
| Minimum | 3.7% | 15.5% |
| Maximum | 100.0% | 36.4% |
| Range | 96.3% | 20.9% |
| Mean | 33.5% | 27.7% |
| Median | 31.4% | 28.0% |
| Interquartile 25% (IQ1) | 28.1% | 22.2% |
| Interquartile 75% (IQ3) | 35.5% | 33.3% |
| Interquartile Range (IQR) | 7.4% | 11.2% |
| Standard Deviation (Sample) | 16.1% | 6.6% |
| Standard Deviation (Population) | 16.0% | 6.4% |
Similar Demographics by Single Mother Poverty
Demographics Similar to Sub-Saharan Africans by Single Mother Poverty
In terms of single mother poverty, the demographic groups most similar to Sub-Saharan Africans are German Russian (31.3%, a difference of 0.070%), Immigrants from Ecuador (31.3%, a difference of 0.090%), Bahamian (31.3%, a difference of 0.11%), Immigrants from Belize (31.4%, a difference of 0.15%), and Immigrants from Senegal (31.5%, a difference of 0.33%).
| Demographics | Rating | Rank | Single Mother Poverty |
| Immigrants | Bangladesh | 0.4 /100 | #259 | Tragic 31.1% |
| Whites/Caucasians | 0.3 /100 | #260 | Tragic 31.2% |
| Immigrants | El Salvador | 0.3 /100 | #261 | Tragic 31.2% |
| Hmong | 0.3 /100 | #262 | Tragic 31.2% |
| Bahamians | 0.2 /100 | #263 | Tragic 31.3% |
| Immigrants | Ecuador | 0.2 /100 | #264 | Tragic 31.3% |
| German Russians | 0.2 /100 | #265 | Tragic 31.3% |
| Sub-Saharan Africans | 0.2 /100 | #266 | Tragic 31.4% |
| Immigrants | Belize | 0.2 /100 | #267 | Tragic 31.4% |
| Immigrants | Senegal | 0.1 /100 | #268 | Tragic 31.5% |
| Scotch-Irish | 0.1 /100 | #269 | Tragic 31.5% |
| British West Indians | 0.1 /100 | #270 | Tragic 31.5% |
| Immigrants | Cabo Verde | 0.1 /100 | #271 | Tragic 31.6% |
| Immigrants | Micronesia | 0.1 /100 | #272 | Tragic 31.6% |
| Fijians | 0.1 /100 | #273 | Tragic 31.6% |
Demographics Similar to South Africans by Single Mother Poverty
In terms of single mother poverty, the demographic groups most similar to South Africans are Immigrants from North America (28.5%, a difference of 0.010%), Luxembourger (28.5%, a difference of 0.020%), Danish (28.5%, a difference of 0.050%), Immigrants from South America (28.5%, a difference of 0.050%), and Immigrants from Denmark (28.5%, a difference of 0.060%).
| Demographics | Rating | Rank | Single Mother Poverty |
| Immigrants | Spain | 89.2 /100 | #135 | Excellent 28.4% |
| Native Hawaiians | 88.9 /100 | #136 | Excellent 28.4% |
| Immigrants | Canada | 88.9 /100 | #137 | Excellent 28.4% |
| Immigrants | Belgium | 88.5 /100 | #138 | Excellent 28.5% |
| Samoans | 88.1 /100 | #139 | Excellent 28.5% |
| Immigrants | Colombia | 88.0 /100 | #140 | Excellent 28.5% |
| Danes | 87.1 /100 | #141 | Excellent 28.5% |
| South Africans | 86.6 /100 | #142 | Excellent 28.5% |
| Immigrants | North America | 86.5 /100 | #143 | Excellent 28.5% |
| Luxembourgers | 86.4 /100 | #144 | Excellent 28.5% |
| Immigrants | South America | 86.1 /100 | #145 | Excellent 28.5% |
| Immigrants | Denmark | 86.1 /100 | #146 | Excellent 28.5% |
| Immigrants | Lebanon | 85.3 /100 | #147 | Excellent 28.6% |
| Syrians | 85.3 /100 | #148 | Excellent 28.6% |
| Serbians | 85.0 /100 | #149 | Excellent 28.6% |