American vs South African Single Mother Poverty
COMPARE
American
South African
Single Mother Poverty
Single Mother Poverty Comparison
Americans
South Africans
33.5%
SINGLE MOTHER POVERTY
0.0/ 100
METRIC RATING
303rd/ 347
METRIC RANK
28.5%
SINGLE MOTHER POVERTY
86.6/ 100
METRIC RATING
142nd/ 347
METRIC RANK
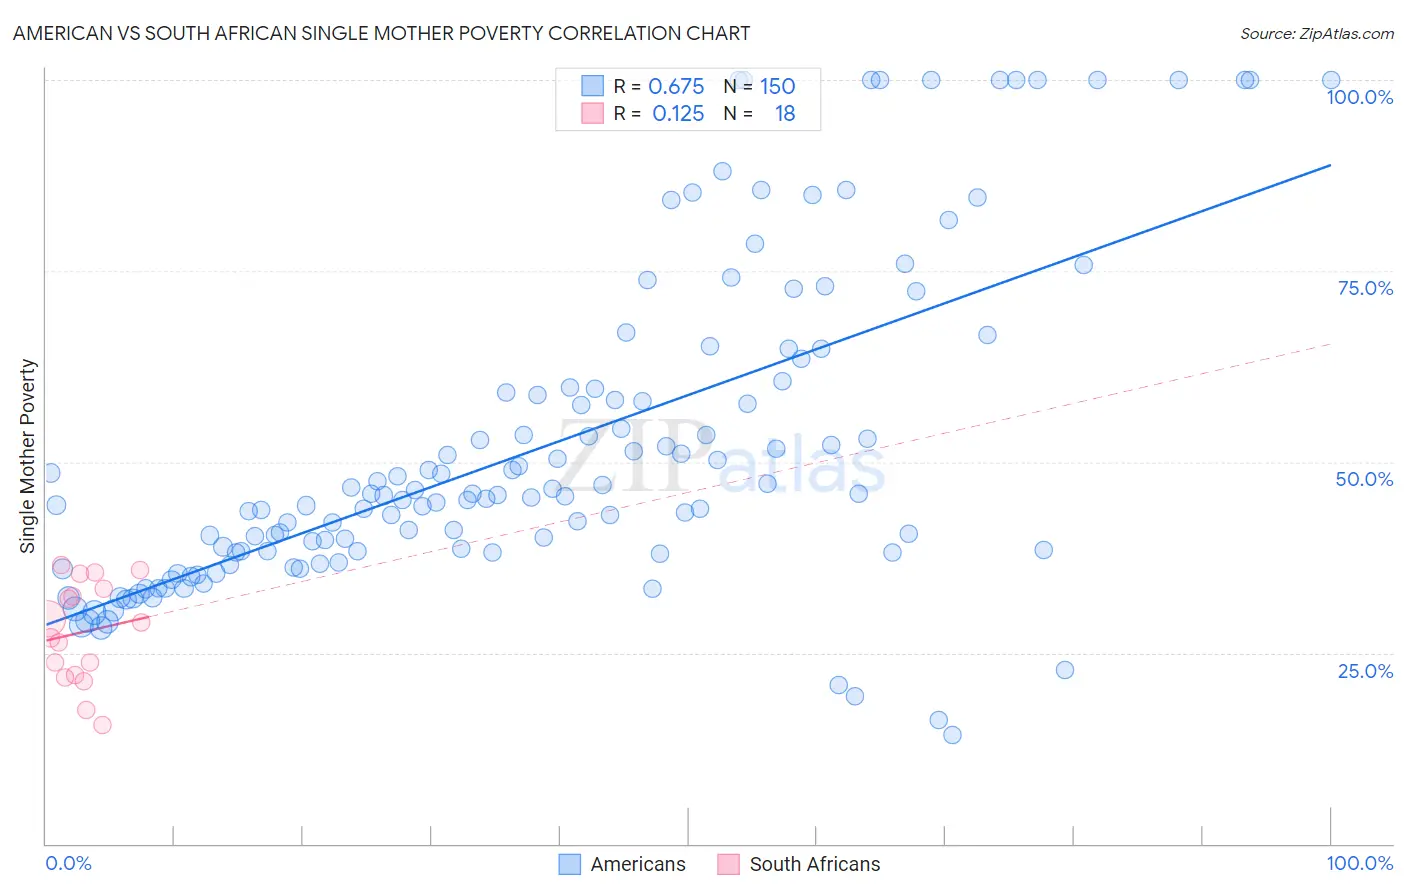
American vs South African Single Mother Poverty Correlation Chart
The statistical analysis conducted on geographies consisting of 551,658,648 people shows a significant positive correlation between the proportion of Americans and poverty level among single mothers in the United States with a correlation coefficient (R) of 0.675 and weighted average of 33.5%. Similarly, the statistical analysis conducted on geographies consisting of 179,638,644 people shows a poor positive correlation between the proportion of South Africans and poverty level among single mothers in the United States with a correlation coefficient (R) of 0.125 and weighted average of 28.5%, a difference of 17.6%.
Single Mother Poverty Correlation Summary
| Measurement | American | South African |
| Minimum | 14.3% | 15.5% |
| Maximum | 100.0% | 36.4% |
| Range | 85.7% | 20.9% |
| Mean | 51.9% | 27.7% |
| Median | 45.5% | 28.0% |
| Interquartile 25% (IQ1) | 38.2% | 22.2% |
| Interquartile 75% (IQ3) | 59.6% | 33.3% |
| Interquartile Range (IQR) | 21.5% | 11.2% |
| Standard Deviation (Sample) | 21.0% | 6.6% |
| Standard Deviation (Population) | 20.9% | 6.4% |
Similar Demographics by Single Mother Poverty
Demographics Similar to Americans by Single Mother Poverty
In terms of single mother poverty, the demographic groups most similar to Americans are Mexican (33.6%, a difference of 0.10%), Immigrants from Central America (33.6%, a difference of 0.15%), Arapaho (33.4%, a difference of 0.26%), Immigrants from Somalia (33.4%, a difference of 0.41%), and Immigrants from Guatemala (33.3%, a difference of 0.65%).
| Demographics | Rating | Rank | Single Mother Poverty |
| Blackfeet | 0.0 /100 | #296 | Tragic 33.2% |
| Pennsylvania Germans | 0.0 /100 | #297 | Tragic 33.2% |
| Africans | 0.0 /100 | #298 | Tragic 33.3% |
| Immigrants | Guatemala | 0.0 /100 | #299 | Tragic 33.3% |
| Hispanics or Latinos | 0.0 /100 | #300 | Tragic 33.3% |
| Immigrants | Somalia | 0.0 /100 | #301 | Tragic 33.4% |
| Arapaho | 0.0 /100 | #302 | Tragic 33.4% |
| Americans | 0.0 /100 | #303 | Tragic 33.5% |
| Mexicans | 0.0 /100 | #304 | Tragic 33.6% |
| Immigrants | Central America | 0.0 /100 | #305 | Tragic 33.6% |
| Immigrants | Congo | 0.0 /100 | #306 | Tragic 33.8% |
| Comanche | 0.0 /100 | #307 | Tragic 33.9% |
| Immigrants | Mexico | 0.0 /100 | #308 | Tragic 34.0% |
| Potawatomi | 0.0 /100 | #309 | Tragic 34.1% |
| Hondurans | 0.0 /100 | #310 | Tragic 34.2% |
Demographics Similar to South Africans by Single Mother Poverty
In terms of single mother poverty, the demographic groups most similar to South Africans are Immigrants from North America (28.5%, a difference of 0.010%), Luxembourger (28.5%, a difference of 0.020%), Danish (28.5%, a difference of 0.050%), Immigrants from South America (28.5%, a difference of 0.050%), and Immigrants from Denmark (28.5%, a difference of 0.060%).
| Demographics | Rating | Rank | Single Mother Poverty |
| Immigrants | Spain | 89.2 /100 | #135 | Excellent 28.4% |
| Native Hawaiians | 88.9 /100 | #136 | Excellent 28.4% |
| Immigrants | Canada | 88.9 /100 | #137 | Excellent 28.4% |
| Immigrants | Belgium | 88.5 /100 | #138 | Excellent 28.5% |
| Samoans | 88.1 /100 | #139 | Excellent 28.5% |
| Immigrants | Colombia | 88.0 /100 | #140 | Excellent 28.5% |
| Danes | 87.1 /100 | #141 | Excellent 28.5% |
| South Africans | 86.6 /100 | #142 | Excellent 28.5% |
| Immigrants | North America | 86.5 /100 | #143 | Excellent 28.5% |
| Luxembourgers | 86.4 /100 | #144 | Excellent 28.5% |
| Immigrants | South America | 86.1 /100 | #145 | Excellent 28.5% |
| Immigrants | Denmark | 86.1 /100 | #146 | Excellent 28.5% |
| Immigrants | Lebanon | 85.3 /100 | #147 | Excellent 28.6% |
| Syrians | 85.3 /100 | #148 | Excellent 28.6% |
| Serbians | 85.0 /100 | #149 | Excellent 28.6% |