Chinese vs Shoshone Single Mother Poverty
COMPARE
Chinese
Shoshone
Single Mother Poverty
Single Mother Poverty Comparison
Chinese
Shoshone
24.6%
SINGLE MOTHER POVERTY
100.0/ 100
METRIC RATING
7th/ 347
METRIC RANK
32.9%
SINGLE MOTHER POVERTY
0.0/ 100
METRIC RATING
292nd/ 347
METRIC RANK
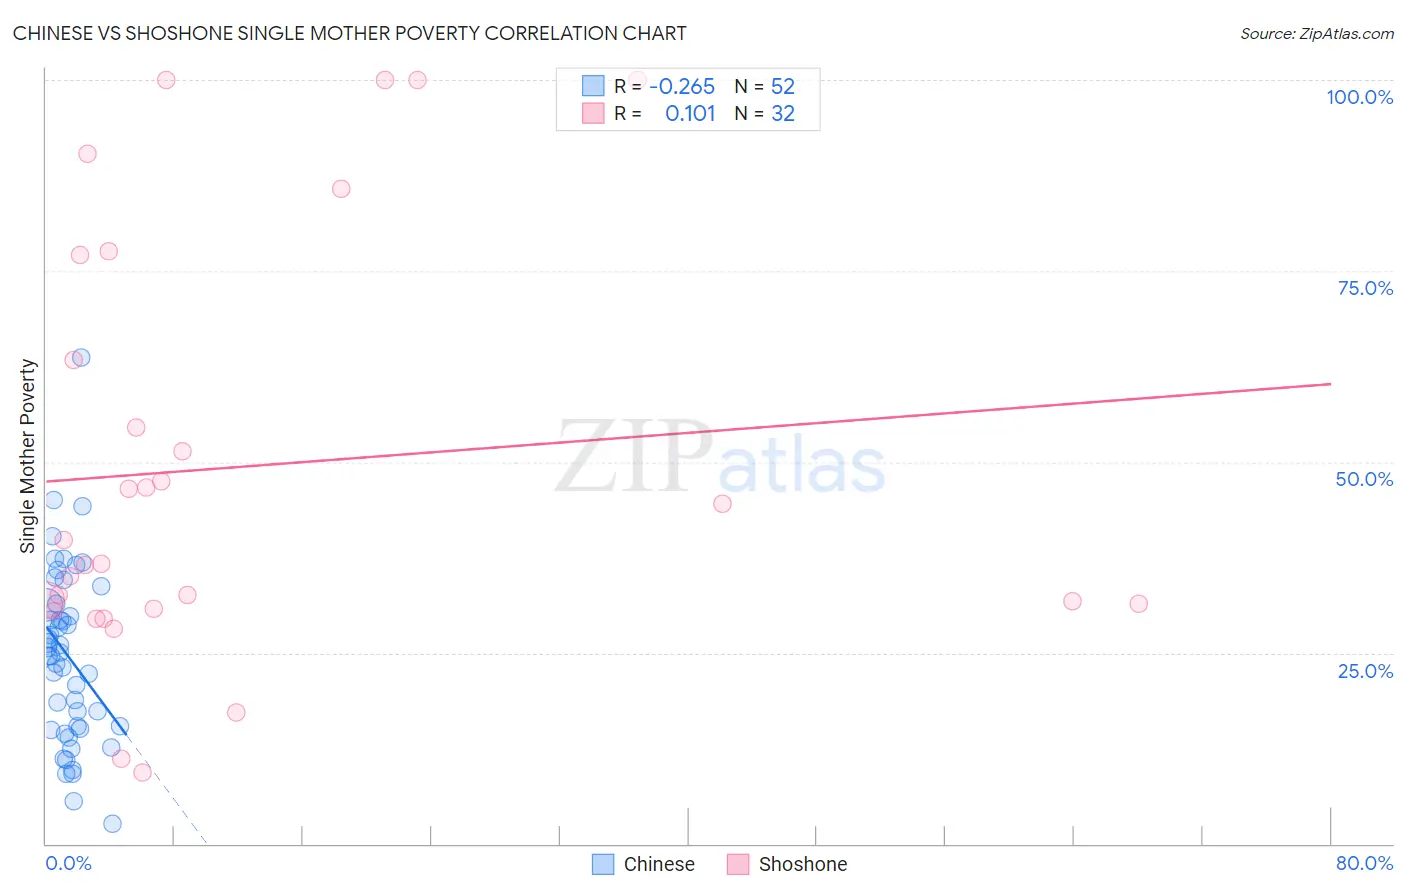
Chinese vs Shoshone Single Mother Poverty Correlation Chart
The statistical analysis conducted on geographies consisting of 64,411,570 people shows a weak negative correlation between the proportion of Chinese and poverty level among single mothers in the United States with a correlation coefficient (R) of -0.265 and weighted average of 24.6%. Similarly, the statistical analysis conducted on geographies consisting of 66,288,381 people shows a poor positive correlation between the proportion of Shoshone and poverty level among single mothers in the United States with a correlation coefficient (R) of 0.101 and weighted average of 32.9%, a difference of 33.7%.
Single Mother Poverty Correlation Summary
| Measurement | Chinese | Shoshone |
| Minimum | 2.6% | 9.3% |
| Maximum | 63.6% | 100.0% |
| Range | 61.1% | 90.7% |
| Mean | 24.6% | 49.3% |
| Median | 24.8% | 38.2% |
| Interquartile 25% (IQ1) | 15.2% | 31.1% |
| Interquartile 75% (IQ3) | 31.4% | 70.2% |
| Interquartile Range (IQR) | 16.2% | 39.1% |
| Standard Deviation (Sample) | 11.6% | 27.4% |
| Standard Deviation (Population) | 11.4% | 27.0% |
Similar Demographics by Single Mother Poverty
Demographics Similar to Chinese by Single Mother Poverty
In terms of single mother poverty, the demographic groups most similar to Chinese are Thai (24.5%, a difference of 0.54%), Immigrants from Hong Kong (24.4%, a difference of 1.0%), Filipino (24.3%, a difference of 1.3%), Immigrants from Iran (25.1%, a difference of 2.0%), and Immigrants from Lithuania (25.2%, a difference of 2.4%).
| Demographics | Rating | Rank | Single Mother Poverty |
| Assyrians/Chaldeans/Syriacs | 100.0 /100 | #1 | Exceptional 23.8% |
| Immigrants | India | 100.0 /100 | #2 | Exceptional 23.8% |
| Immigrants | Taiwan | 100.0 /100 | #3 | Exceptional 23.9% |
| Filipinos | 100.0 /100 | #4 | Exceptional 24.3% |
| Immigrants | Hong Kong | 100.0 /100 | #5 | Exceptional 24.4% |
| Thais | 100.0 /100 | #6 | Exceptional 24.5% |
| Chinese | 100.0 /100 | #7 | Exceptional 24.6% |
| Immigrants | Iran | 100.0 /100 | #8 | Exceptional 25.1% |
| Immigrants | Lithuania | 100.0 /100 | #9 | Exceptional 25.2% |
| Immigrants | South Central Asia | 100.0 /100 | #10 | Exceptional 25.3% |
| Iranians | 100.0 /100 | #11 | Exceptional 25.5% |
| Bhutanese | 100.0 /100 | #12 | Exceptional 25.6% |
| Indians (Asian) | 100.0 /100 | #13 | Exceptional 25.8% |
| Immigrants | Singapore | 100.0 /100 | #14 | Exceptional 25.8% |
| Immigrants | Ireland | 100.0 /100 | #15 | Exceptional 25.8% |
Demographics Similar to Shoshone by Single Mother Poverty
In terms of single mother poverty, the demographic groups most similar to Shoshone are Guatemalan (32.9%, a difference of 0.020%), Aleut (32.9%, a difference of 0.030%), French American Indian (33.1%, a difference of 0.66%), Yaqui (33.1%, a difference of 0.69%), and Blackfeet (33.2%, a difference of 0.85%).
| Demographics | Rating | Rank | Single Mother Poverty |
| Immigrants | Latin America | 0.0 /100 | #285 | Tragic 32.4% |
| Yup'ik | 0.0 /100 | #286 | Tragic 32.5% |
| Immigrants | Dominica | 0.0 /100 | #287 | Tragic 32.5% |
| Somalis | 0.0 /100 | #288 | Tragic 32.6% |
| U.S. Virgin Islanders | 0.0 /100 | #289 | Tragic 32.6% |
| Osage | 0.0 /100 | #290 | Tragic 32.6% |
| Guatemalans | 0.0 /100 | #291 | Tragic 32.9% |
| Shoshone | 0.0 /100 | #292 | Tragic 32.9% |
| Aleuts | 0.0 /100 | #293 | Tragic 32.9% |
| French American Indians | 0.0 /100 | #294 | Tragic 33.1% |
| Yaqui | 0.0 /100 | #295 | Tragic 33.1% |
| Blackfeet | 0.0 /100 | #296 | Tragic 33.2% |
| Pennsylvania Germans | 0.0 /100 | #297 | Tragic 33.2% |
| Africans | 0.0 /100 | #298 | Tragic 33.3% |
| Immigrants | Guatemala | 0.0 /100 | #299 | Tragic 33.3% |