Chilean vs Hawaiian Single Mother Poverty
COMPARE
Chilean
Hawaiian
Single Mother Poverty
Single Mother Poverty Comparison
Chileans
Hawaiians
27.9%
SINGLE MOTHER POVERTY
97.5/ 100
METRIC RATING
95th/ 347
METRIC RANK
29.2%
SINGLE MOTHER POVERTY
47.8/ 100
METRIC RATING
176th/ 347
METRIC RANK
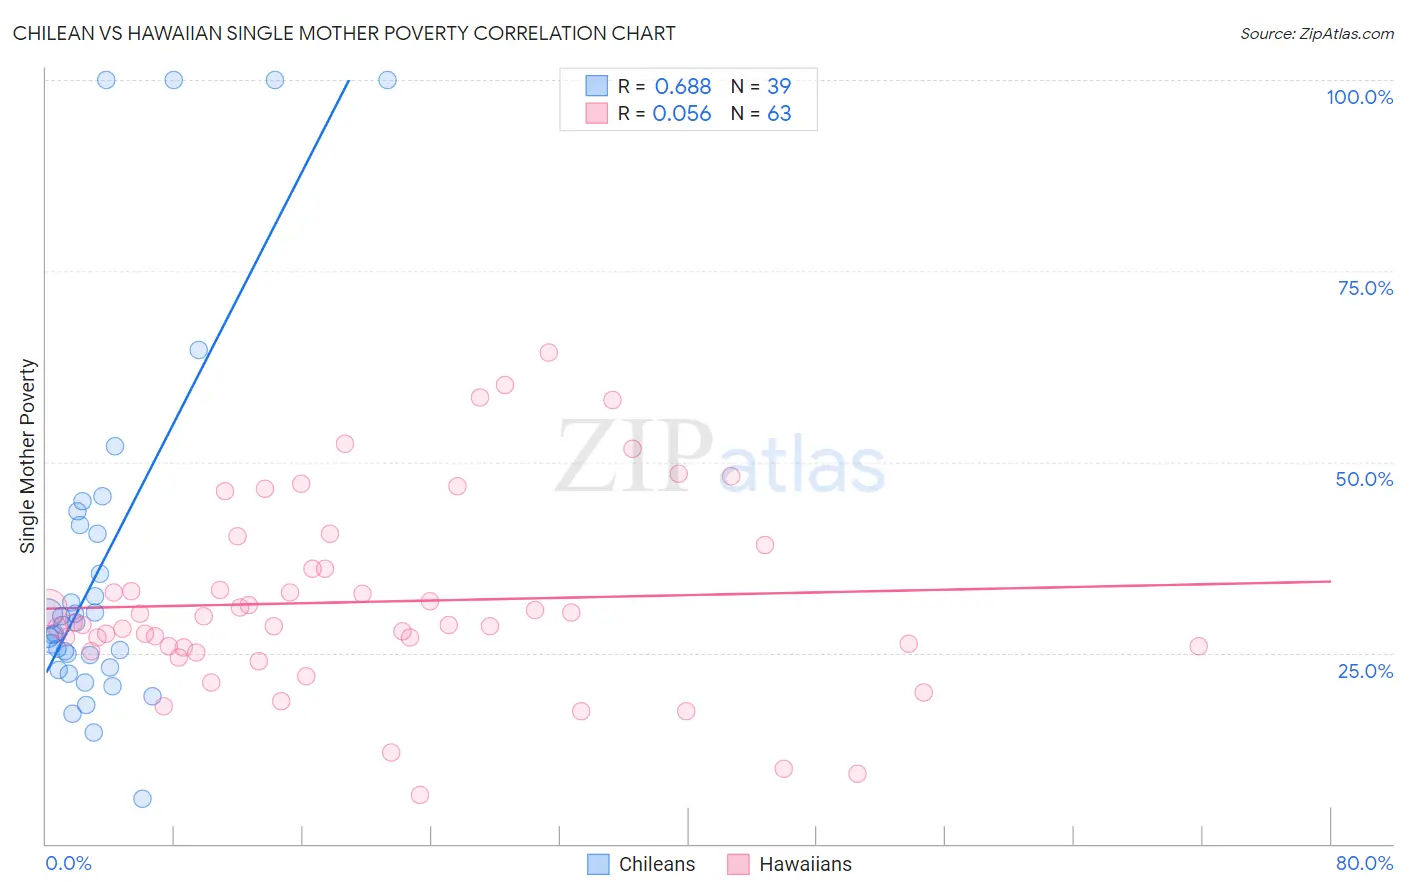
Chilean vs Hawaiian Single Mother Poverty Correlation Chart
The statistical analysis conducted on geographies consisting of 252,857,793 people shows a significant positive correlation between the proportion of Chileans and poverty level among single mothers in the United States with a correlation coefficient (R) of 0.688 and weighted average of 27.9%. Similarly, the statistical analysis conducted on geographies consisting of 322,664,662 people shows a slight positive correlation between the proportion of Hawaiians and poverty level among single mothers in the United States with a correlation coefficient (R) of 0.056 and weighted average of 29.2%, a difference of 4.7%.
Single Mother Poverty Correlation Summary
| Measurement | Chilean | Hawaiian |
| Minimum | 5.9% | 6.4% |
| Maximum | 100.0% | 64.3% |
| Range | 94.1% | 57.9% |
| Mean | 36.6% | 31.7% |
| Median | 28.7% | 28.6% |
| Interquartile 25% (IQ1) | 23.1% | 25.7% |
| Interquartile 75% (IQ3) | 41.7% | 36.0% |
| Interquartile Range (IQR) | 18.5% | 10.3% |
| Standard Deviation (Sample) | 24.2% | 12.4% |
| Standard Deviation (Population) | 23.9% | 12.3% |
Similar Demographics by Single Mother Poverty
Demographics Similar to Chileans by Single Mother Poverty
In terms of single mother poverty, the demographic groups most similar to Chileans are Albanian (27.9%, a difference of 0.030%), Immigrants from Iraq (27.9%, a difference of 0.10%), Romanian (27.8%, a difference of 0.13%), Immigrants from Brazil (27.9%, a difference of 0.14%), and Immigrants from Nepal (27.9%, a difference of 0.15%).
| Demographics | Rating | Rank | Single Mother Poverty |
| Ethiopians | 98.4 /100 | #88 | Exceptional 27.7% |
| Immigrants | Ethiopia | 98.4 /100 | #89 | Exceptional 27.7% |
| Immigrants | France | 98.2 /100 | #90 | Exceptional 27.8% |
| Immigrants | Albania | 98.0 /100 | #91 | Exceptional 27.8% |
| Estonians | 97.9 /100 | #92 | Exceptional 27.8% |
| Romanians | 97.8 /100 | #93 | Exceptional 27.8% |
| Albanians | 97.6 /100 | #94 | Exceptional 27.9% |
| Chileans | 97.5 /100 | #95 | Exceptional 27.9% |
| Immigrants | Iraq | 97.3 /100 | #96 | Exceptional 27.9% |
| Immigrants | Brazil | 97.2 /100 | #97 | Exceptional 27.9% |
| Immigrants | Nepal | 97.2 /100 | #98 | Exceptional 27.9% |
| Immigrants | Netherlands | 97.2 /100 | #99 | Exceptional 27.9% |
| Zimbabweans | 97.1 /100 | #100 | Exceptional 27.9% |
| Pakistanis | 96.9 /100 | #101 | Exceptional 28.0% |
| Immigrants | Croatia | 96.7 /100 | #102 | Exceptional 28.0% |
Demographics Similar to Hawaiians by Single Mother Poverty
In terms of single mother poverty, the demographic groups most similar to Hawaiians are Immigrants from Costa Rica (29.2%, a difference of 0.040%), Immigrants from Saudi Arabia (29.2%, a difference of 0.10%), British (29.2%, a difference of 0.13%), Immigrants from Bosnia and Herzegovina (29.2%, a difference of 0.13%), and South American Indian (29.3%, a difference of 0.22%).
| Demographics | Rating | Rank | Single Mother Poverty |
| Immigrants | Uruguay | 57.2 /100 | #169 | Average 29.1% |
| New Zealanders | 55.1 /100 | #170 | Average 29.1% |
| Puget Sound Salish | 55.1 /100 | #171 | Average 29.1% |
| Carpatho Rusyns | 53.8 /100 | #172 | Average 29.1% |
| British | 50.6 /100 | #173 | Average 29.2% |
| Immigrants | Saudi Arabia | 50.0 /100 | #174 | Average 29.2% |
| Immigrants | Costa Rica | 48.8 /100 | #175 | Average 29.2% |
| Hawaiians | 47.8 /100 | #176 | Average 29.2% |
| Immigrants | Bosnia and Herzegovina | 45.1 /100 | #177 | Average 29.2% |
| South American Indians | 43.2 /100 | #178 | Average 29.3% |
| Immigrants | Uzbekistan | 42.6 /100 | #179 | Average 29.3% |
| Immigrants | Norway | 41.5 /100 | #180 | Average 29.3% |
| Canadians | 40.4 /100 | #181 | Average 29.3% |
| Immigrants | Eastern Africa | 38.5 /100 | #182 | Fair 29.3% |
| Nepalese | 38.3 /100 | #183 | Fair 29.3% |