Chilean vs American Single Mother Poverty
COMPARE
Chilean
American
Single Mother Poverty
Single Mother Poverty Comparison
Chileans
Americans
27.9%
SINGLE MOTHER POVERTY
97.5/ 100
METRIC RATING
95th/ 347
METRIC RANK
33.5%
SINGLE MOTHER POVERTY
0.0/ 100
METRIC RATING
303rd/ 347
METRIC RANK
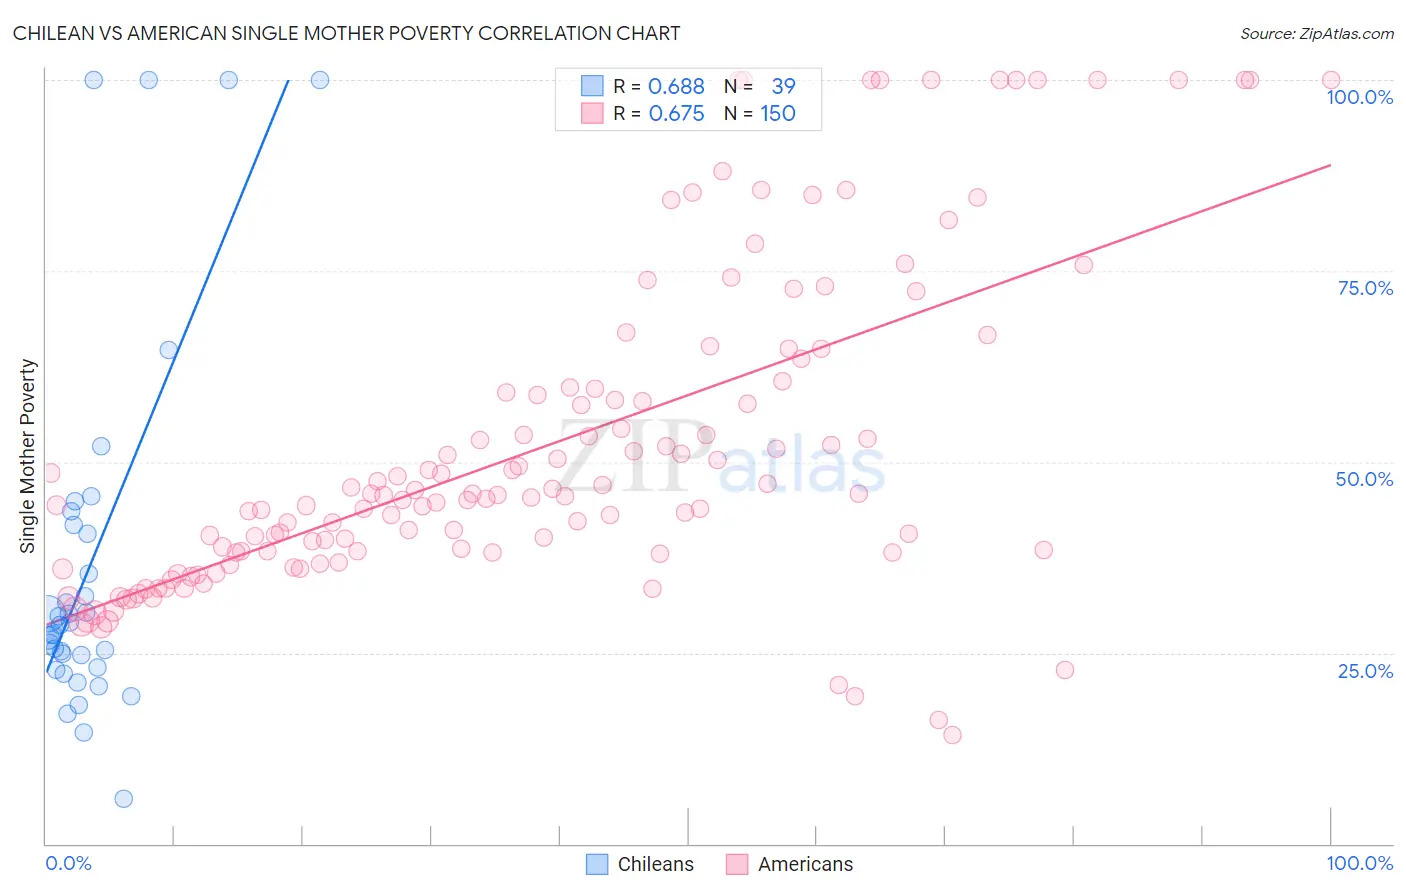
Chilean vs American Single Mother Poverty Correlation Chart
The statistical analysis conducted on geographies consisting of 252,857,793 people shows a significant positive correlation between the proportion of Chileans and poverty level among single mothers in the United States with a correlation coefficient (R) of 0.688 and weighted average of 27.9%. Similarly, the statistical analysis conducted on geographies consisting of 551,658,648 people shows a significant positive correlation between the proportion of Americans and poverty level among single mothers in the United States with a correlation coefficient (R) of 0.675 and weighted average of 33.5%, a difference of 20.2%.
Single Mother Poverty Correlation Summary
| Measurement | Chilean | American |
| Minimum | 5.9% | 14.3% |
| Maximum | 100.0% | 100.0% |
| Range | 94.1% | 85.7% |
| Mean | 36.6% | 51.9% |
| Median | 28.7% | 45.5% |
| Interquartile 25% (IQ1) | 23.1% | 38.2% |
| Interquartile 75% (IQ3) | 41.7% | 59.6% |
| Interquartile Range (IQR) | 18.5% | 21.5% |
| Standard Deviation (Sample) | 24.2% | 21.0% |
| Standard Deviation (Population) | 23.9% | 20.9% |
Similar Demographics by Single Mother Poverty
Demographics Similar to Chileans by Single Mother Poverty
In terms of single mother poverty, the demographic groups most similar to Chileans are Albanian (27.9%, a difference of 0.030%), Immigrants from Iraq (27.9%, a difference of 0.10%), Romanian (27.8%, a difference of 0.13%), Immigrants from Brazil (27.9%, a difference of 0.14%), and Immigrants from Nepal (27.9%, a difference of 0.15%).
| Demographics | Rating | Rank | Single Mother Poverty |
| Ethiopians | 98.4 /100 | #88 | Exceptional 27.7% |
| Immigrants | Ethiopia | 98.4 /100 | #89 | Exceptional 27.7% |
| Immigrants | France | 98.2 /100 | #90 | Exceptional 27.8% |
| Immigrants | Albania | 98.0 /100 | #91 | Exceptional 27.8% |
| Estonians | 97.9 /100 | #92 | Exceptional 27.8% |
| Romanians | 97.8 /100 | #93 | Exceptional 27.8% |
| Albanians | 97.6 /100 | #94 | Exceptional 27.9% |
| Chileans | 97.5 /100 | #95 | Exceptional 27.9% |
| Immigrants | Iraq | 97.3 /100 | #96 | Exceptional 27.9% |
| Immigrants | Brazil | 97.2 /100 | #97 | Exceptional 27.9% |
| Immigrants | Nepal | 97.2 /100 | #98 | Exceptional 27.9% |
| Immigrants | Netherlands | 97.2 /100 | #99 | Exceptional 27.9% |
| Zimbabweans | 97.1 /100 | #100 | Exceptional 27.9% |
| Pakistanis | 96.9 /100 | #101 | Exceptional 28.0% |
| Immigrants | Croatia | 96.7 /100 | #102 | Exceptional 28.0% |
Demographics Similar to Americans by Single Mother Poverty
In terms of single mother poverty, the demographic groups most similar to Americans are Mexican (33.6%, a difference of 0.10%), Immigrants from Central America (33.6%, a difference of 0.15%), Arapaho (33.4%, a difference of 0.26%), Immigrants from Somalia (33.4%, a difference of 0.41%), and Immigrants from Guatemala (33.3%, a difference of 0.65%).
| Demographics | Rating | Rank | Single Mother Poverty |
| Blackfeet | 0.0 /100 | #296 | Tragic 33.2% |
| Pennsylvania Germans | 0.0 /100 | #297 | Tragic 33.2% |
| Africans | 0.0 /100 | #298 | Tragic 33.3% |
| Immigrants | Guatemala | 0.0 /100 | #299 | Tragic 33.3% |
| Hispanics or Latinos | 0.0 /100 | #300 | Tragic 33.3% |
| Immigrants | Somalia | 0.0 /100 | #301 | Tragic 33.4% |
| Arapaho | 0.0 /100 | #302 | Tragic 33.4% |
| Americans | 0.0 /100 | #303 | Tragic 33.5% |
| Mexicans | 0.0 /100 | #304 | Tragic 33.6% |
| Immigrants | Central America | 0.0 /100 | #305 | Tragic 33.6% |
| Immigrants | Congo | 0.0 /100 | #306 | Tragic 33.8% |
| Comanche | 0.0 /100 | #307 | Tragic 33.9% |
| Immigrants | Mexico | 0.0 /100 | #308 | Tragic 34.0% |
| Potawatomi | 0.0 /100 | #309 | Tragic 34.1% |
| Hondurans | 0.0 /100 | #310 | Tragic 34.2% |