Chilean vs Eastern European Single Mother Poverty
COMPARE
Chilean
Eastern European
Single Mother Poverty
Single Mother Poverty Comparison
Chileans
Eastern Europeans
27.9%
SINGLE MOTHER POVERTY
97.5/ 100
METRIC RATING
95th/ 347
METRIC RANK
27.2%
SINGLE MOTHER POVERTY
99.6/ 100
METRIC RATING
60th/ 347
METRIC RANK
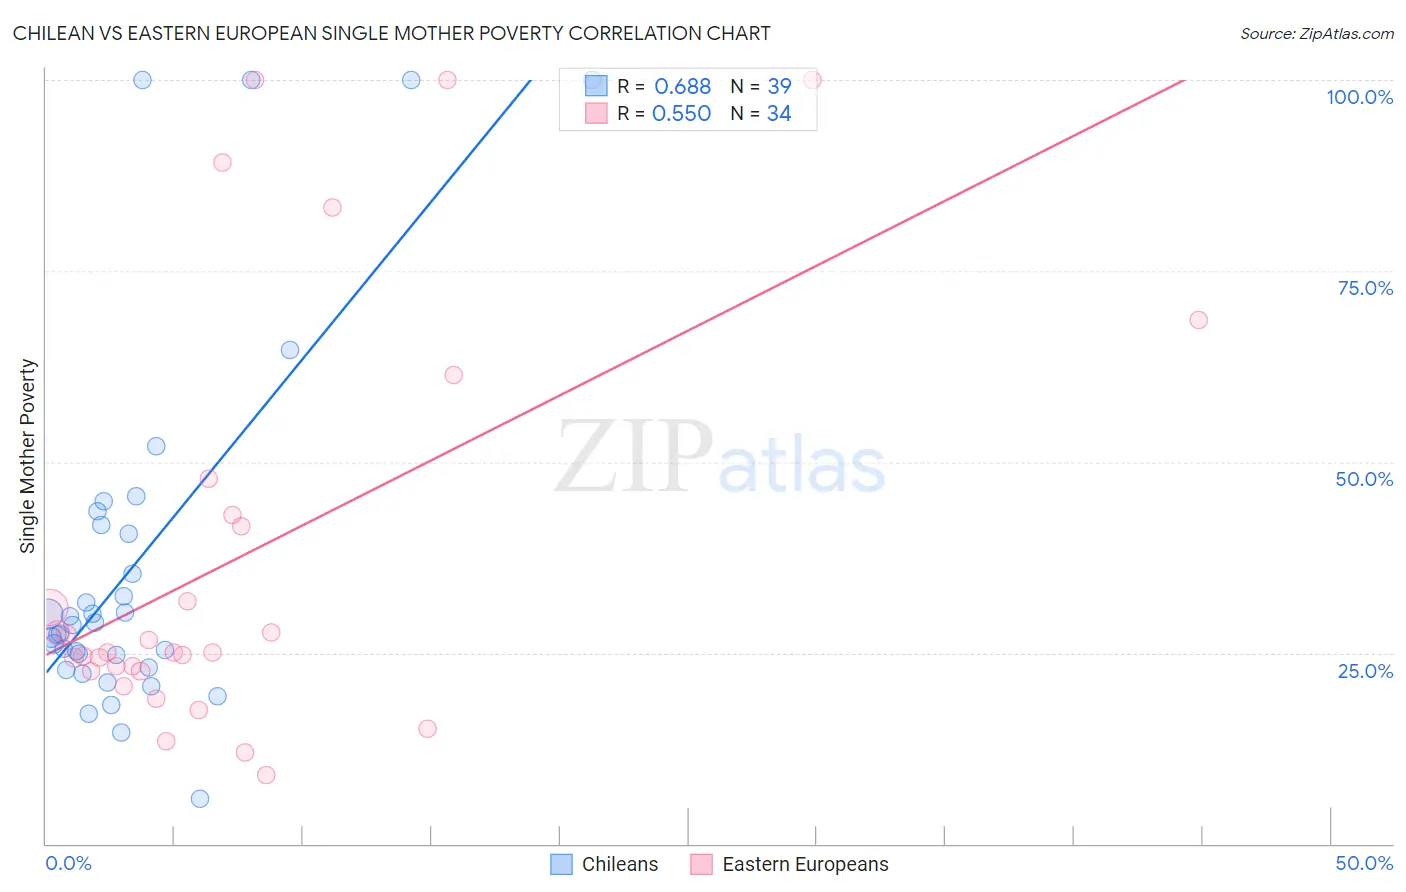
Chilean vs Eastern European Single Mother Poverty Correlation Chart
The statistical analysis conducted on geographies consisting of 252,857,793 people shows a significant positive correlation between the proportion of Chileans and poverty level among single mothers in the United States with a correlation coefficient (R) of 0.688 and weighted average of 27.9%. Similarly, the statistical analysis conducted on geographies consisting of 444,414,902 people shows a substantial positive correlation between the proportion of Eastern Europeans and poverty level among single mothers in the United States with a correlation coefficient (R) of 0.550 and weighted average of 27.2%, a difference of 2.5%.
Single Mother Poverty Correlation Summary
| Measurement | Chilean | Eastern European |
| Minimum | 5.9% | 9.0% |
| Maximum | 100.0% | 100.0% |
| Range | 94.1% | 91.0% |
| Mean | 36.6% | 37.6% |
| Median | 28.7% | 25.1% |
| Interquartile 25% (IQ1) | 23.1% | 22.7% |
| Interquartile 75% (IQ3) | 41.7% | 43.0% |
| Interquartile Range (IQR) | 18.5% | 20.3% |
| Standard Deviation (Sample) | 24.2% | 27.1% |
| Standard Deviation (Population) | 23.9% | 26.7% |
Similar Demographics by Single Mother Poverty
Demographics Similar to Chileans by Single Mother Poverty
In terms of single mother poverty, the demographic groups most similar to Chileans are Albanian (27.9%, a difference of 0.030%), Immigrants from Iraq (27.9%, a difference of 0.10%), Romanian (27.8%, a difference of 0.13%), Immigrants from Brazil (27.9%, a difference of 0.14%), and Immigrants from Nepal (27.9%, a difference of 0.15%).
| Demographics | Rating | Rank | Single Mother Poverty |
| Ethiopians | 98.4 /100 | #88 | Exceptional 27.7% |
| Immigrants | Ethiopia | 98.4 /100 | #89 | Exceptional 27.7% |
| Immigrants | France | 98.2 /100 | #90 | Exceptional 27.8% |
| Immigrants | Albania | 98.0 /100 | #91 | Exceptional 27.8% |
| Estonians | 97.9 /100 | #92 | Exceptional 27.8% |
| Romanians | 97.8 /100 | #93 | Exceptional 27.8% |
| Albanians | 97.6 /100 | #94 | Exceptional 27.9% |
| Chileans | 97.5 /100 | #95 | Exceptional 27.9% |
| Immigrants | Iraq | 97.3 /100 | #96 | Exceptional 27.9% |
| Immigrants | Brazil | 97.2 /100 | #97 | Exceptional 27.9% |
| Immigrants | Nepal | 97.2 /100 | #98 | Exceptional 27.9% |
| Immigrants | Netherlands | 97.2 /100 | #99 | Exceptional 27.9% |
| Zimbabweans | 97.1 /100 | #100 | Exceptional 27.9% |
| Pakistanis | 96.9 /100 | #101 | Exceptional 28.0% |
| Immigrants | Croatia | 96.7 /100 | #102 | Exceptional 28.0% |
Demographics Similar to Eastern Europeans by Single Mother Poverty
In terms of single mother poverty, the demographic groups most similar to Eastern Europeans are Paraguayan (27.2%, a difference of 0.040%), Argentinean (27.2%, a difference of 0.050%), Immigrants from Eastern Europe (27.2%, a difference of 0.11%), Palestinian (27.2%, a difference of 0.21%), and Immigrants from Romania (27.2%, a difference of 0.23%).
| Demographics | Rating | Rank | Single Mother Poverty |
| Immigrants | Jordan | 99.7 /100 | #53 | Exceptional 27.1% |
| Immigrants | Bulgaria | 99.7 /100 | #54 | Exceptional 27.1% |
| Immigrants | Egypt | 99.7 /100 | #55 | Exceptional 27.1% |
| Immigrants | Romania | 99.7 /100 | #56 | Exceptional 27.2% |
| Palestinians | 99.7 /100 | #57 | Exceptional 27.2% |
| Argentineans | 99.6 /100 | #58 | Exceptional 27.2% |
| Paraguayans | 99.6 /100 | #59 | Exceptional 27.2% |
| Eastern Europeans | 99.6 /100 | #60 | Exceptional 27.2% |
| Immigrants | Eastern Europe | 99.6 /100 | #61 | Exceptional 27.2% |
| Immigrants | Malaysia | 99.5 /100 | #62 | Exceptional 27.3% |
| Immigrants | Northern Europe | 99.5 /100 | #63 | Exceptional 27.3% |
| Russians | 99.5 /100 | #64 | Exceptional 27.3% |
| Immigrants | Turkey | 99.5 /100 | #65 | Exceptional 27.3% |
| Soviet Union | 99.5 /100 | #66 | Exceptional 27.3% |
| Immigrants | Australia | 99.5 /100 | #67 | Exceptional 27.3% |