Chilean vs Immigrants from Oceania In Labor Force | Age 20-24
COMPARE
Chilean
Immigrants from Oceania
In Labor Force | Age 20-24
In Labor Force | Age 20-24 Comparison
Chileans
Immigrants from Oceania
74.5%
IN LABOR FORCE | AGE 20-24
12.5/ 100
METRIC RATING
217th/ 347
METRIC RANK
76.1%
IN LABOR FORCE | AGE 20-24
98.0/ 100
METRIC RATING
98th/ 347
METRIC RANK
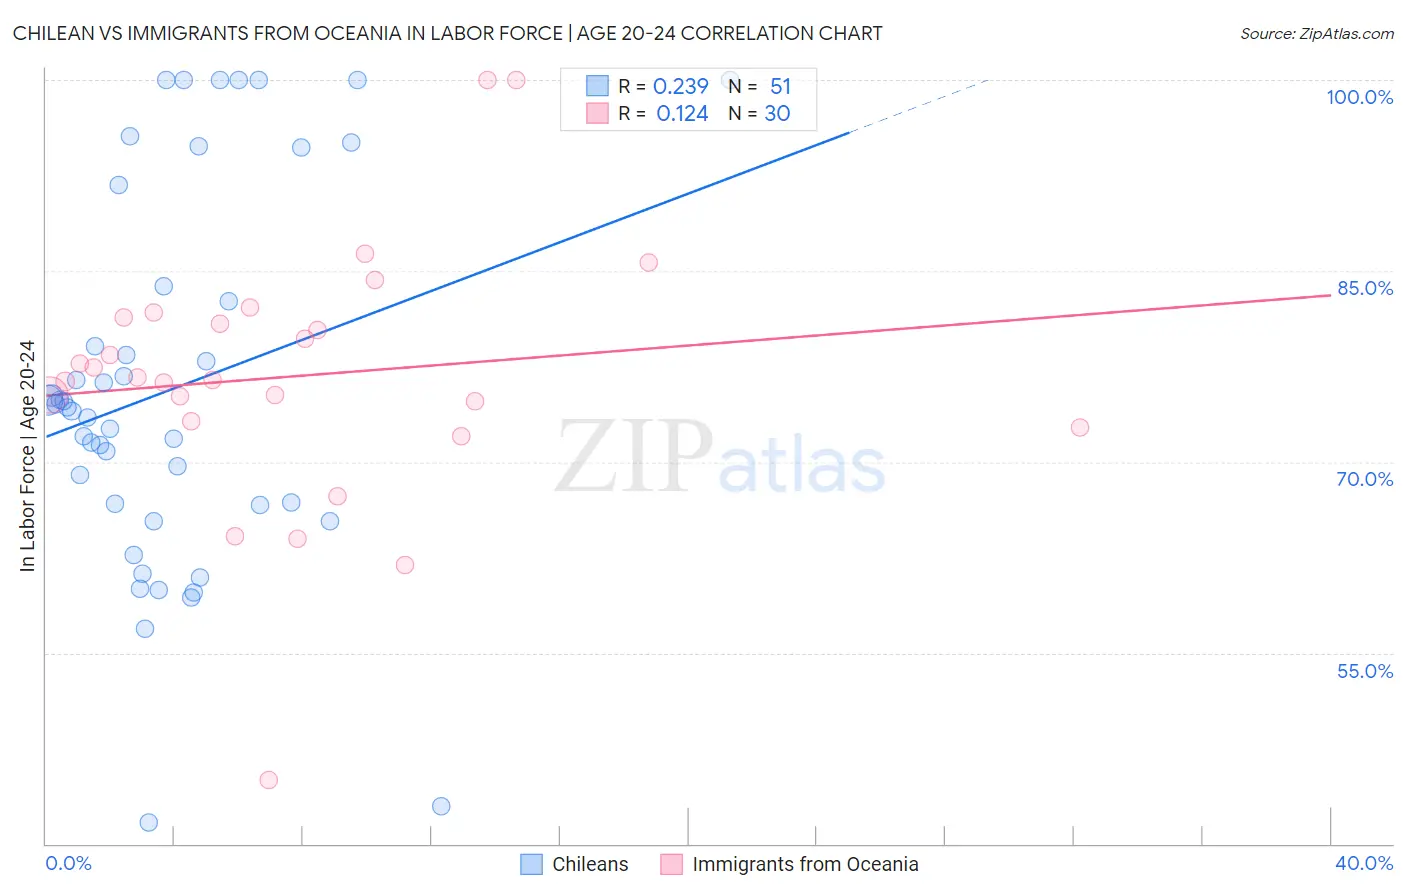
Chilean vs Immigrants from Oceania In Labor Force | Age 20-24 Correlation Chart
The statistical analysis conducted on geographies consisting of 256,670,531 people shows a weak positive correlation between the proportion of Chileans and labor force participation rate among population between the ages 20 and 24 in the United States with a correlation coefficient (R) of 0.239 and weighted average of 74.5%. Similarly, the statistical analysis conducted on geographies consisting of 305,402,520 people shows a poor positive correlation between the proportion of Immigrants from Oceania and labor force participation rate among population between the ages 20 and 24 in the United States with a correlation coefficient (R) of 0.124 and weighted average of 76.1%, a difference of 2.1%.
In Labor Force | Age 20-24 Correlation Summary
| Measurement | Chilean | Immigrants from Oceania |
| Minimum | 41.7% | 45.0% |
| Maximum | 100.0% | 100.0% |
| Range | 58.3% | 55.0% |
| Mean | 75.8% | 76.7% |
| Median | 74.3% | 76.5% |
| Interquartile 25% (IQ1) | 66.6% | 73.2% |
| Interquartile 75% (IQ3) | 83.8% | 81.4% |
| Interquartile Range (IQR) | 17.3% | 8.2% |
| Standard Deviation (Sample) | 14.8% | 10.4% |
| Standard Deviation (Population) | 14.6% | 10.2% |
Similar Demographics by In Labor Force | Age 20-24
Demographics Similar to Chileans by In Labor Force | Age 20-24
In terms of in labor force | age 20-24, the demographic groups most similar to Chileans are Immigrants from Ghana (74.5%, a difference of 0.010%), Immigrants from Kuwait (74.5%, a difference of 0.010%), Immigrants from Southern Europe (74.5%, a difference of 0.020%), Creek (74.5%, a difference of 0.030%), and Peruvian (74.5%, a difference of 0.030%).
| Demographics | Rating | Rank | In Labor Force | Age 20-24 |
| Uruguayans | 15.1 /100 | #210 | Poor 74.6% |
| Immigrants | Australia | 14.7 /100 | #211 | Poor 74.6% |
| Creek | 13.3 /100 | #212 | Poor 74.5% |
| Peruvians | 13.3 /100 | #213 | Poor 74.5% |
| Immigrants | Southern Europe | 13.2 /100 | #214 | Poor 74.5% |
| Immigrants | Ghana | 12.7 /100 | #215 | Poor 74.5% |
| Immigrants | Kuwait | 12.7 /100 | #216 | Poor 74.5% |
| Chileans | 12.5 /100 | #217 | Poor 74.5% |
| Immigrants | Peru | 10.6 /100 | #218 | Poor 74.5% |
| Nepalese | 10.5 /100 | #219 | Poor 74.5% |
| Immigrants | Norway | 10.3 /100 | #220 | Poor 74.5% |
| Chickasaw | 10.3 /100 | #221 | Poor 74.5% |
| Immigrants | India | 9.9 /100 | #222 | Tragic 74.4% |
| Hispanics or Latinos | 7.9 /100 | #223 | Tragic 74.4% |
| Seminole | 6.9 /100 | #224 | Tragic 74.3% |
Demographics Similar to Immigrants from Oceania by In Labor Force | Age 20-24
In terms of in labor force | age 20-24, the demographic groups most similar to Immigrants from Oceania are Immigrants from Lithuania (76.1%, a difference of 0.0%), American (76.1%, a difference of 0.030%), Shoshone (76.1%, a difference of 0.040%), Immigrants from Poland (76.1%, a difference of 0.050%), and Latvian (76.1%, a difference of 0.060%).
| Demographics | Rating | Rank | In Labor Force | Age 20-24 |
| Sierra Leoneans | 99.0 /100 | #91 | Exceptional 76.3% |
| Maltese | 98.9 /100 | #92 | Exceptional 76.3% |
| Hungarians | 98.9 /100 | #93 | Exceptional 76.3% |
| Potawatomi | 98.5 /100 | #94 | Exceptional 76.2% |
| Immigrants | Germany | 98.5 /100 | #95 | Exceptional 76.2% |
| Immigrants | Nonimmigrants | 98.5 /100 | #96 | Exceptional 76.2% |
| Immigrants | Lithuania | 98.0 /100 | #97 | Exceptional 76.1% |
| Immigrants | Oceania | 98.0 /100 | #98 | Exceptional 76.1% |
| Americans | 97.8 /100 | #99 | Exceptional 76.1% |
| Shoshone | 97.8 /100 | #100 | Exceptional 76.1% |
| Immigrants | Poland | 97.7 /100 | #101 | Exceptional 76.1% |
| Latvians | 97.6 /100 | #102 | Exceptional 76.1% |
| Immigrants | North Macedonia | 97.5 /100 | #103 | Exceptional 76.1% |
| Macedonians | 97.2 /100 | #104 | Exceptional 76.0% |
| Immigrants | Nepal | 97.2 /100 | #105 | Exceptional 76.0% |