Chilean vs Immigrants from Ghana Family Poverty
COMPARE
Chilean
Immigrants from Ghana
Family Poverty
Family Poverty Comparison
Chileans
Immigrants from Ghana
8.5%
FAMILY POVERTY
86.6/ 100
METRIC RATING
134th/ 347
METRIC RANK
10.8%
FAMILY POVERTY
0.2/ 100
METRIC RATING
257th/ 347
METRIC RANK
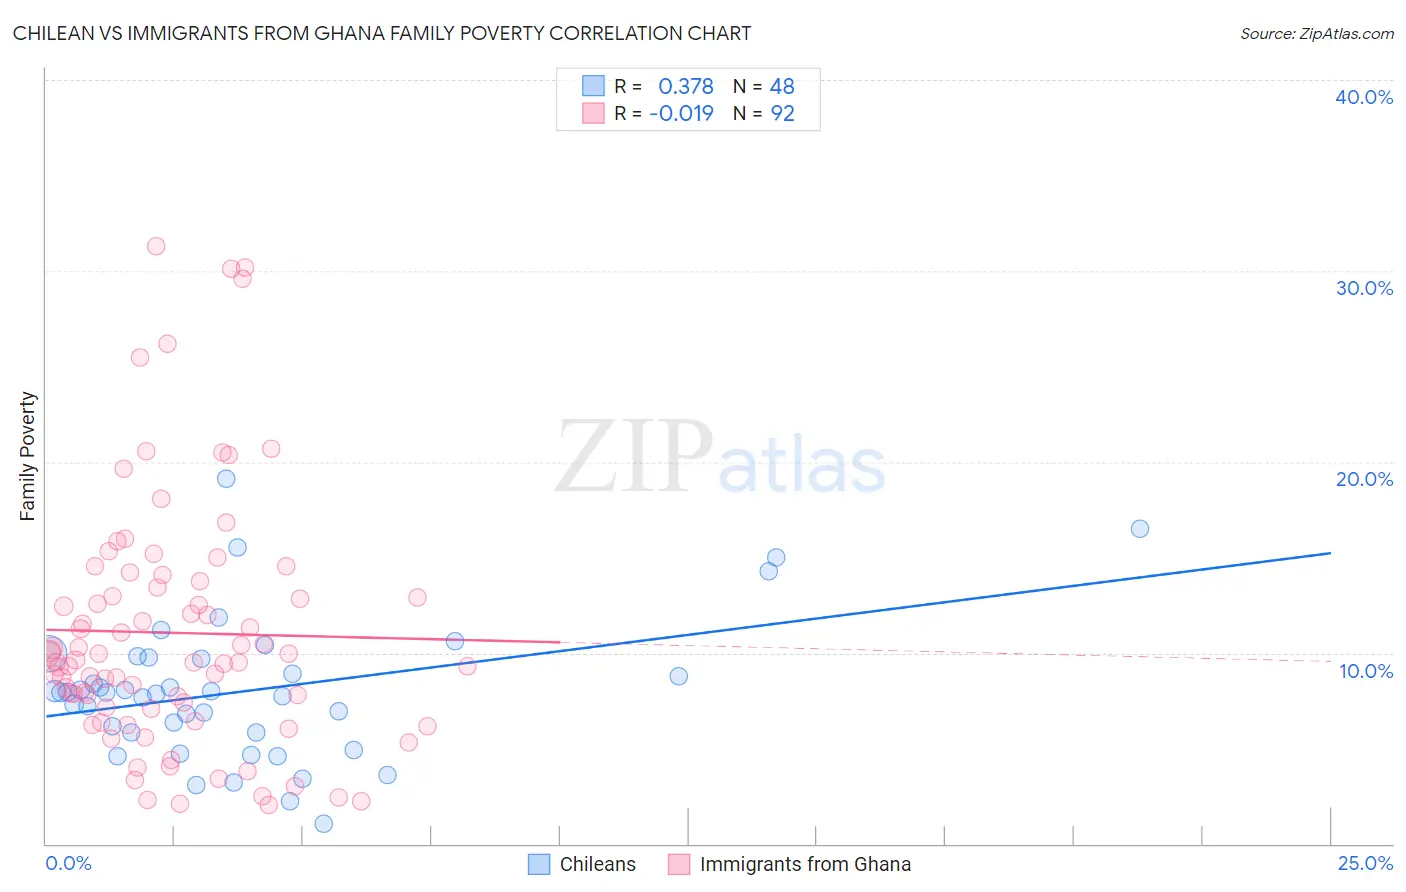
Chilean vs Immigrants from Ghana Family Poverty Correlation Chart
The statistical analysis conducted on geographies consisting of 256,264,406 people shows a mild positive correlation between the proportion of Chileans and poverty level among families in the United States with a correlation coefficient (R) of 0.378 and weighted average of 8.5%. Similarly, the statistical analysis conducted on geographies consisting of 199,614,936 people shows no correlation between the proportion of Immigrants from Ghana and poverty level among families in the United States with a correlation coefficient (R) of -0.019 and weighted average of 10.8%, a difference of 28.3%.
Family Poverty Correlation Summary
| Measurement | Chilean | Immigrants from Ghana |
| Minimum | 1.0% | 2.0% |
| Maximum | 19.1% | 31.3% |
| Range | 18.1% | 29.3% |
| Mean | 8.0% | 11.0% |
| Median | 7.9% | 9.6% |
| Interquartile 25% (IQ1) | 5.8% | 7.1% |
| Interquartile 75% (IQ3) | 9.7% | 13.6% |
| Interquartile Range (IQR) | 3.9% | 6.5% |
| Standard Deviation (Sample) | 3.7% | 6.5% |
| Standard Deviation (Population) | 3.6% | 6.5% |
Similar Demographics by Family Poverty
Demographics Similar to Chileans by Family Poverty
In terms of family poverty, the demographic groups most similar to Chileans are Sri Lankan (8.5%, a difference of 0.010%), Immigrants from Malaysia (8.5%, a difference of 0.040%), Immigrants from Brazil (8.5%, a difference of 0.080%), Immigrants from Southern Europe (8.5%, a difference of 0.16%), and Immigrants from Argentina (8.4%, a difference of 0.51%).
| Demographics | Rating | Rank | Family Poverty |
| Immigrants | Hungary | 89.9 /100 | #127 | Excellent 8.4% |
| Argentineans | 89.6 /100 | #128 | Excellent 8.4% |
| Portuguese | 89.2 /100 | #129 | Excellent 8.4% |
| Immigrants | Bosnia and Herzegovina | 88.6 /100 | #130 | Excellent 8.4% |
| Puget Sound Salish | 88.6 /100 | #131 | Excellent 8.4% |
| Immigrants | Argentina | 88.2 /100 | #132 | Excellent 8.4% |
| Sri Lankans | 86.6 /100 | #133 | Excellent 8.5% |
| Chileans | 86.6 /100 | #134 | Excellent 8.5% |
| Immigrants | Malaysia | 86.5 /100 | #135 | Excellent 8.5% |
| Immigrants | Brazil | 86.3 /100 | #136 | Excellent 8.5% |
| Immigrants | Southern Europe | 86.0 /100 | #137 | Excellent 8.5% |
| Armenians | 84.6 /100 | #138 | Excellent 8.5% |
| Immigrants | Nepal | 84.2 /100 | #139 | Excellent 8.5% |
| Immigrants | Kazakhstan | 84.1 /100 | #140 | Excellent 8.5% |
| Immigrants | Ukraine | 83.9 /100 | #141 | Excellent 8.5% |
Demographics Similar to Immigrants from Ghana by Family Poverty
In terms of family poverty, the demographic groups most similar to Immigrants from Ghana are Subsaharan African (10.9%, a difference of 0.030%), Chickasaw (10.8%, a difference of 0.040%), Mexican American Indian (10.9%, a difference of 0.070%), Immigrants from Liberia (10.8%, a difference of 0.30%), and Bangladeshi (10.9%, a difference of 0.42%).
| Demographics | Rating | Rank | Family Poverty |
| Salvadorans | 0.3 /100 | #250 | Tragic 10.7% |
| Iroquois | 0.3 /100 | #251 | Tragic 10.7% |
| Immigrants | Zaire | 0.3 /100 | #252 | Tragic 10.7% |
| Immigrants | Western Africa | 0.3 /100 | #253 | Tragic 10.7% |
| Ecuadorians | 0.2 /100 | #254 | Tragic 10.8% |
| Immigrants | Liberia | 0.2 /100 | #255 | Tragic 10.8% |
| Chickasaw | 0.2 /100 | #256 | Tragic 10.8% |
| Immigrants | Ghana | 0.2 /100 | #257 | Tragic 10.8% |
| Sub-Saharan Africans | 0.2 /100 | #258 | Tragic 10.9% |
| Mexican American Indians | 0.2 /100 | #259 | Tragic 10.9% |
| Bangladeshis | 0.2 /100 | #260 | Tragic 10.9% |
| Shoshone | 0.2 /100 | #261 | Tragic 10.9% |
| Spanish American Indians | 0.2 /100 | #262 | Tragic 10.9% |
| Cape Verdeans | 0.1 /100 | #263 | Tragic 10.9% |
| Trinidadians and Tobagonians | 0.1 /100 | #264 | Tragic 10.9% |