Chilean vs Immigrants from Lithuania Family Poverty
COMPARE
Chilean
Immigrants from Lithuania
Family Poverty
Family Poverty Comparison
Chileans
Immigrants from Lithuania
8.5%
FAMILY POVERTY
86.6/ 100
METRIC RATING
134th/ 347
METRIC RANK
7.2%
FAMILY POVERTY
99.8/ 100
METRIC RATING
18th/ 347
METRIC RANK
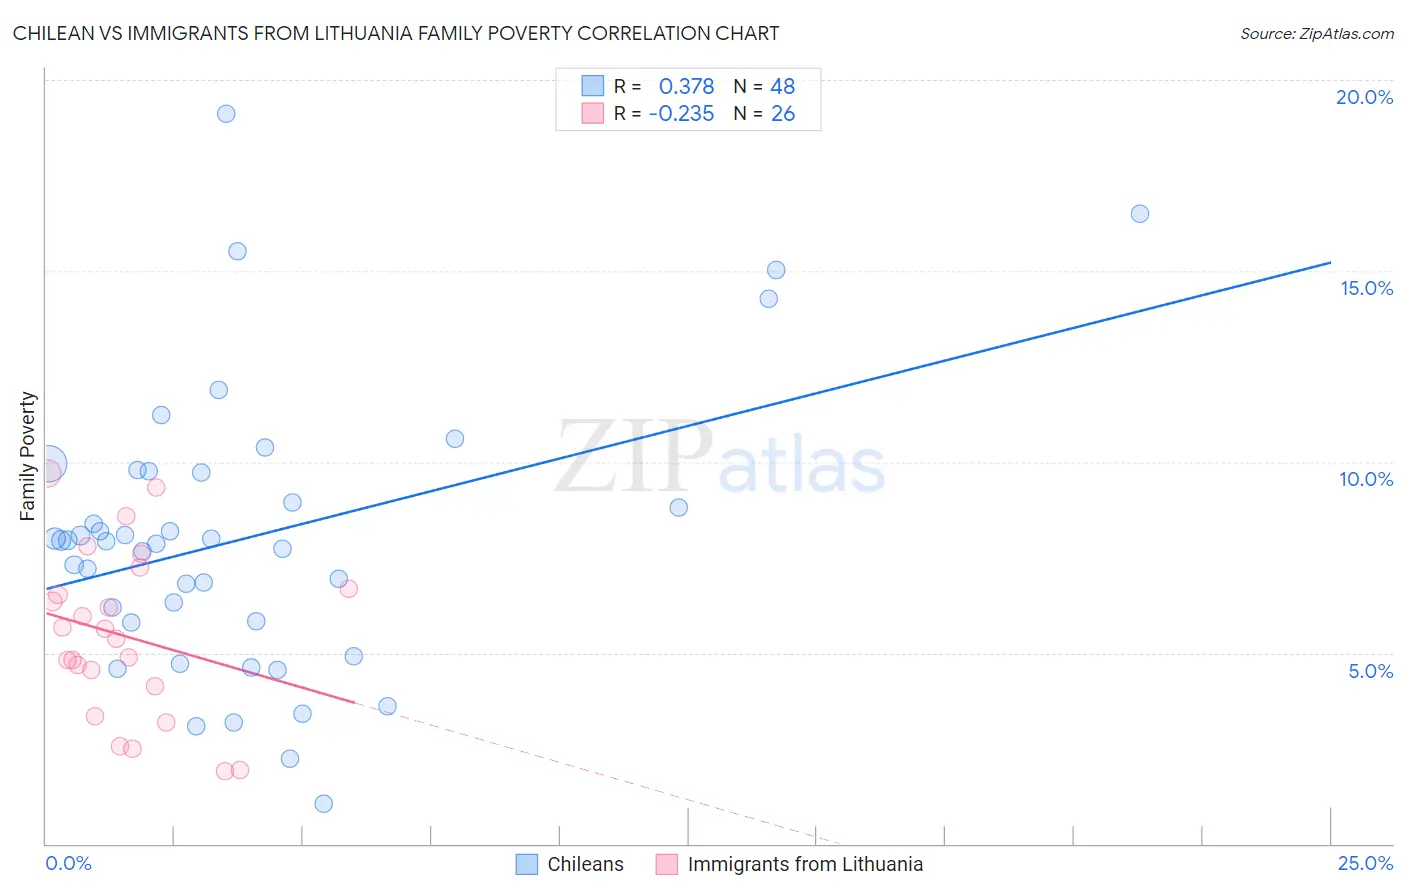
Chilean vs Immigrants from Lithuania Family Poverty Correlation Chart
The statistical analysis conducted on geographies consisting of 256,264,406 people shows a mild positive correlation between the proportion of Chileans and poverty level among families in the United States with a correlation coefficient (R) of 0.378 and weighted average of 8.5%. Similarly, the statistical analysis conducted on geographies consisting of 117,605,958 people shows a weak negative correlation between the proportion of Immigrants from Lithuania and poverty level among families in the United States with a correlation coefficient (R) of -0.235 and weighted average of 7.2%, a difference of 17.1%.
Family Poverty Correlation Summary
| Measurement | Chilean | Immigrants from Lithuania |
| Minimum | 1.0% | 1.9% |
| Maximum | 19.1% | 9.7% |
| Range | 18.1% | 7.8% |
| Mean | 8.0% | 5.5% |
| Median | 7.9% | 5.5% |
| Interquartile 25% (IQ1) | 5.8% | 4.1% |
| Interquartile 75% (IQ3) | 9.7% | 6.7% |
| Interquartile Range (IQR) | 3.9% | 2.5% |
| Standard Deviation (Sample) | 3.7% | 2.2% |
| Standard Deviation (Population) | 3.6% | 2.1% |
Similar Demographics by Family Poverty
Demographics Similar to Chileans by Family Poverty
In terms of family poverty, the demographic groups most similar to Chileans are Sri Lankan (8.5%, a difference of 0.010%), Immigrants from Malaysia (8.5%, a difference of 0.040%), Immigrants from Brazil (8.5%, a difference of 0.080%), Immigrants from Southern Europe (8.5%, a difference of 0.16%), and Immigrants from Argentina (8.4%, a difference of 0.51%).
| Demographics | Rating | Rank | Family Poverty |
| Immigrants | Hungary | 89.9 /100 | #127 | Excellent 8.4% |
| Argentineans | 89.6 /100 | #128 | Excellent 8.4% |
| Portuguese | 89.2 /100 | #129 | Excellent 8.4% |
| Immigrants | Bosnia and Herzegovina | 88.6 /100 | #130 | Excellent 8.4% |
| Puget Sound Salish | 88.6 /100 | #131 | Excellent 8.4% |
| Immigrants | Argentina | 88.2 /100 | #132 | Excellent 8.4% |
| Sri Lankans | 86.6 /100 | #133 | Excellent 8.5% |
| Chileans | 86.6 /100 | #134 | Excellent 8.5% |
| Immigrants | Malaysia | 86.5 /100 | #135 | Excellent 8.5% |
| Immigrants | Brazil | 86.3 /100 | #136 | Excellent 8.5% |
| Immigrants | Southern Europe | 86.0 /100 | #137 | Excellent 8.5% |
| Armenians | 84.6 /100 | #138 | Excellent 8.5% |
| Immigrants | Nepal | 84.2 /100 | #139 | Excellent 8.5% |
| Immigrants | Kazakhstan | 84.1 /100 | #140 | Excellent 8.5% |
| Immigrants | Ukraine | 83.9 /100 | #141 | Excellent 8.5% |
Demographics Similar to Immigrants from Lithuania by Family Poverty
In terms of family poverty, the demographic groups most similar to Immigrants from Lithuania are Luxembourger (7.2%, a difference of 0.010%), Immigrants from South Central Asia (7.2%, a difference of 0.24%), Eastern European (7.2%, a difference of 0.30%), Immigrants from Hong Kong (7.3%, a difference of 0.46%), and Lithuanian (7.2%, a difference of 0.51%).
| Demographics | Rating | Rank | Family Poverty |
| Immigrants | Singapore | 99.8 /100 | #11 | Exceptional 7.1% |
| Maltese | 99.8 /100 | #12 | Exceptional 7.1% |
| Swedes | 99.8 /100 | #13 | Exceptional 7.1% |
| Iranians | 99.8 /100 | #14 | Exceptional 7.1% |
| Lithuanians | 99.8 /100 | #15 | Exceptional 7.2% |
| Immigrants | South Central Asia | 99.8 /100 | #16 | Exceptional 7.2% |
| Luxembourgers | 99.8 /100 | #17 | Exceptional 7.2% |
| Immigrants | Lithuania | 99.8 /100 | #18 | Exceptional 7.2% |
| Eastern Europeans | 99.7 /100 | #19 | Exceptional 7.2% |
| Immigrants | Hong Kong | 99.7 /100 | #20 | Exceptional 7.3% |
| Immigrants | Iran | 99.7 /100 | #21 | Exceptional 7.3% |
| Danes | 99.7 /100 | #22 | Exceptional 7.3% |
| Assyrians/Chaldeans/Syriacs | 99.7 /100 | #23 | Exceptional 7.3% |
| Croatians | 99.7 /100 | #24 | Exceptional 7.3% |
| Burmese | 99.7 /100 | #25 | Exceptional 7.3% |