Immigrants from Latvia vs Immigrants from Ghana Family Poverty
COMPARE
Immigrants from Latvia
Immigrants from Ghana
Family Poverty
Family Poverty Comparison
Immigrants from Latvia
Immigrants from Ghana
7.9%
FAMILY POVERTY
98.0/ 100
METRIC RATING
76th/ 347
METRIC RANK
10.8%
FAMILY POVERTY
0.2/ 100
METRIC RATING
257th/ 347
METRIC RANK
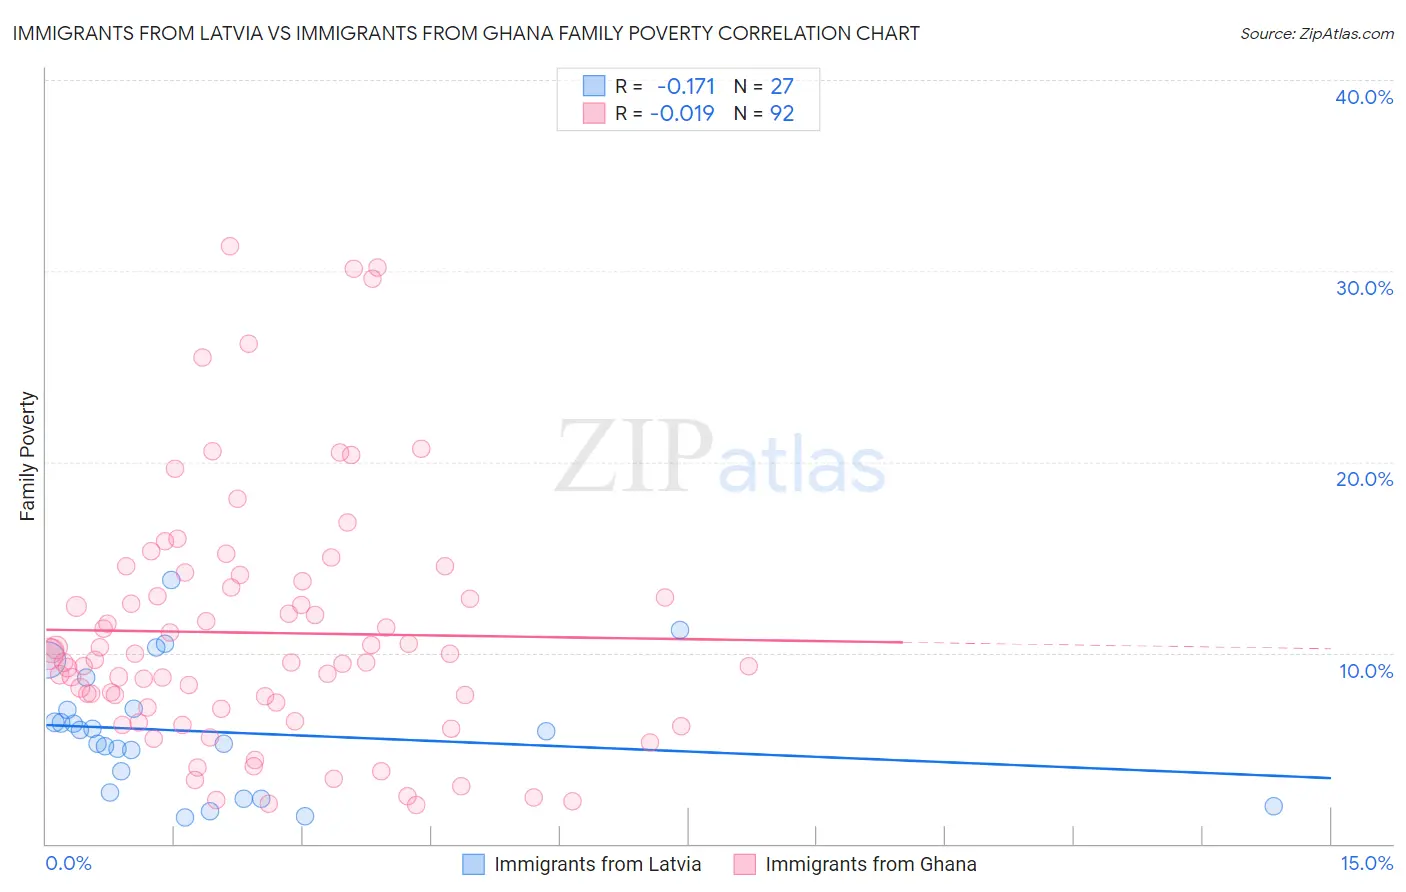
Immigrants from Latvia vs Immigrants from Ghana Family Poverty Correlation Chart
The statistical analysis conducted on geographies consisting of 113,662,762 people shows a poor negative correlation between the proportion of Immigrants from Latvia and poverty level among families in the United States with a correlation coefficient (R) of -0.171 and weighted average of 7.9%. Similarly, the statistical analysis conducted on geographies consisting of 199,614,936 people shows no correlation between the proportion of Immigrants from Ghana and poverty level among families in the United States with a correlation coefficient (R) of -0.019 and weighted average of 10.8%, a difference of 37.9%.
Family Poverty Correlation Summary
| Measurement | Immigrants from Latvia | Immigrants from Ghana |
| Minimum | 1.4% | 2.0% |
| Maximum | 13.8% | 31.3% |
| Range | 12.5% | 29.3% |
| Mean | 5.9% | 11.0% |
| Median | 5.9% | 9.6% |
| Interquartile 25% (IQ1) | 2.7% | 7.1% |
| Interquartile 75% (IQ3) | 7.1% | 13.6% |
| Interquartile Range (IQR) | 4.4% | 6.5% |
| Standard Deviation (Sample) | 3.2% | 6.5% |
| Standard Deviation (Population) | 3.2% | 6.5% |
Similar Demographics by Family Poverty
Demographics Similar to Immigrants from Latvia by Family Poverty
In terms of family poverty, the demographic groups most similar to Immigrants from Latvia are Ukrainian (7.9%, a difference of 0.010%), Immigrants from North America (7.9%, a difference of 0.12%), Immigrants from Europe (7.9%, a difference of 0.20%), Immigrants from Croatia (7.8%, a difference of 0.23%), and English (7.9%, a difference of 0.26%).
| Demographics | Rating | Rank | Family Poverty |
| Immigrants | Belgium | 98.2 /100 | #69 | Exceptional 7.8% |
| Immigrants | Canada | 98.2 /100 | #70 | Exceptional 7.8% |
| Cambodians | 98.2 /100 | #71 | Exceptional 7.8% |
| Immigrants | Romania | 98.2 /100 | #72 | Exceptional 7.8% |
| Austrians | 98.2 /100 | #73 | Exceptional 7.8% |
| Immigrants | China | 98.1 /100 | #74 | Exceptional 7.8% |
| Immigrants | Croatia | 98.1 /100 | #75 | Exceptional 7.8% |
| Immigrants | Latvia | 98.0 /100 | #76 | Exceptional 7.9% |
| Ukrainians | 98.0 /100 | #77 | Exceptional 7.9% |
| Immigrants | North America | 97.9 /100 | #78 | Exceptional 7.9% |
| Immigrants | Europe | 97.8 /100 | #79 | Exceptional 7.9% |
| English | 97.8 /100 | #80 | Exceptional 7.9% |
| Irish | 97.8 /100 | #81 | Exceptional 7.9% |
| Immigrants | Poland | 97.8 /100 | #82 | Exceptional 7.9% |
| Slovaks | 97.7 /100 | #83 | Exceptional 7.9% |
Demographics Similar to Immigrants from Ghana by Family Poverty
In terms of family poverty, the demographic groups most similar to Immigrants from Ghana are Subsaharan African (10.9%, a difference of 0.030%), Chickasaw (10.8%, a difference of 0.040%), Mexican American Indian (10.9%, a difference of 0.070%), Immigrants from Liberia (10.8%, a difference of 0.30%), and Bangladeshi (10.9%, a difference of 0.42%).
| Demographics | Rating | Rank | Family Poverty |
| Salvadorans | 0.3 /100 | #250 | Tragic 10.7% |
| Iroquois | 0.3 /100 | #251 | Tragic 10.7% |
| Immigrants | Zaire | 0.3 /100 | #252 | Tragic 10.7% |
| Immigrants | Western Africa | 0.3 /100 | #253 | Tragic 10.7% |
| Ecuadorians | 0.2 /100 | #254 | Tragic 10.8% |
| Immigrants | Liberia | 0.2 /100 | #255 | Tragic 10.8% |
| Chickasaw | 0.2 /100 | #256 | Tragic 10.8% |
| Immigrants | Ghana | 0.2 /100 | #257 | Tragic 10.8% |
| Sub-Saharan Africans | 0.2 /100 | #258 | Tragic 10.9% |
| Mexican American Indians | 0.2 /100 | #259 | Tragic 10.9% |
| Bangladeshis | 0.2 /100 | #260 | Tragic 10.9% |
| Shoshone | 0.2 /100 | #261 | Tragic 10.9% |
| Spanish American Indians | 0.2 /100 | #262 | Tragic 10.9% |
| Cape Verdeans | 0.1 /100 | #263 | Tragic 10.9% |
| Trinidadians and Tobagonians | 0.1 /100 | #264 | Tragic 10.9% |