Chilean vs Immigrants from Sierra Leone Family Poverty
COMPARE
Chilean
Immigrants from Sierra Leone
Family Poverty
Family Poverty Comparison
Chileans
Immigrants from Sierra Leone
8.5%
FAMILY POVERTY
86.6/ 100
METRIC RATING
134th/ 347
METRIC RANK
9.4%
FAMILY POVERTY
19.6/ 100
METRIC RATING
202nd/ 347
METRIC RANK
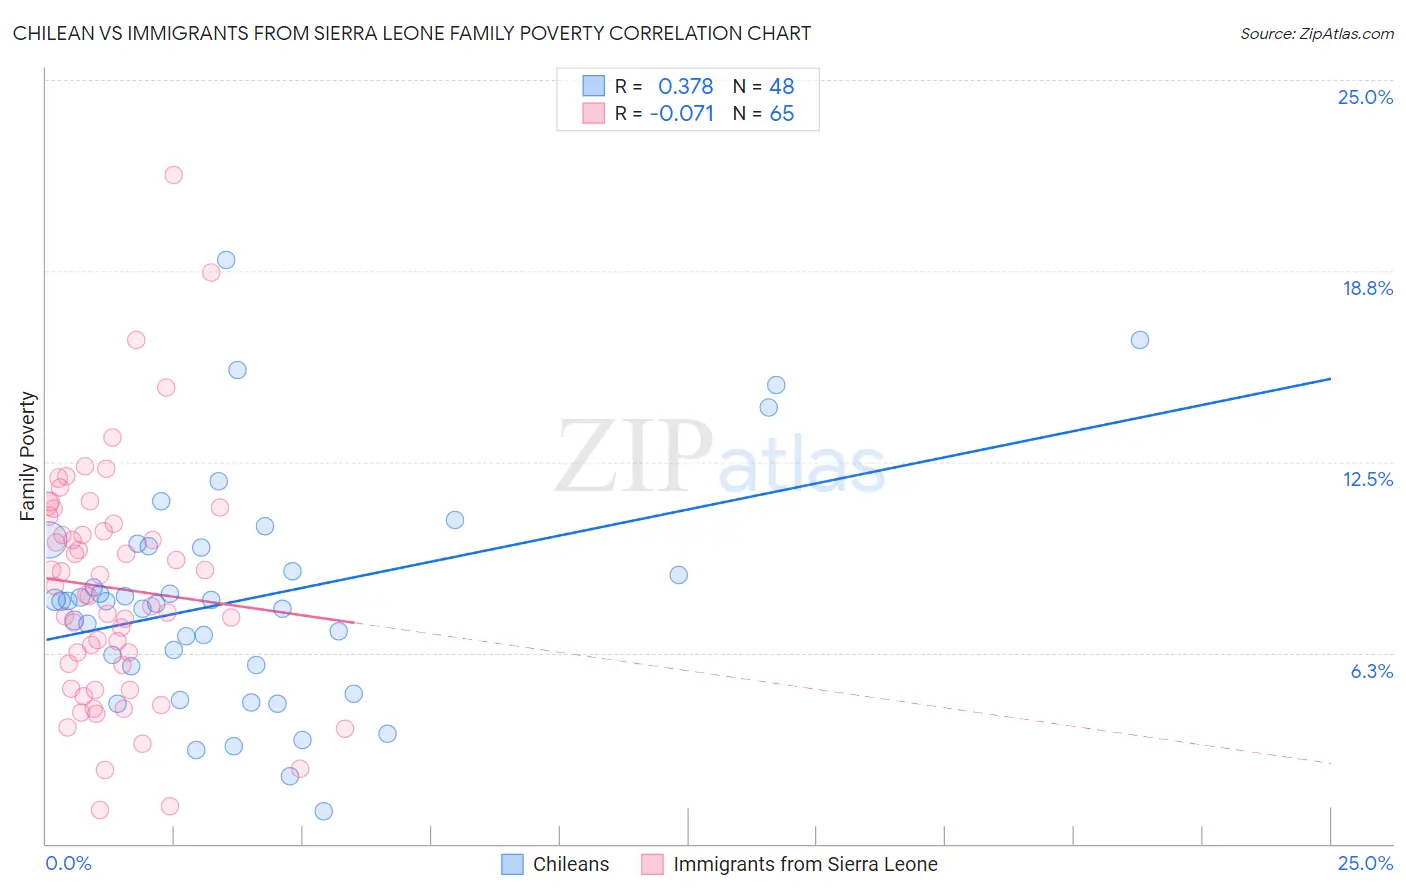
Chilean vs Immigrants from Sierra Leone Family Poverty Correlation Chart
The statistical analysis conducted on geographies consisting of 256,264,406 people shows a mild positive correlation between the proportion of Chileans and poverty level among families in the United States with a correlation coefficient (R) of 0.378 and weighted average of 8.5%. Similarly, the statistical analysis conducted on geographies consisting of 101,579,524 people shows a slight negative correlation between the proportion of Immigrants from Sierra Leone and poverty level among families in the United States with a correlation coefficient (R) of -0.071 and weighted average of 9.4%, a difference of 11.4%.
Family Poverty Correlation Summary
| Measurement | Chilean | Immigrants from Sierra Leone |
| Minimum | 1.0% | 1.1% |
| Maximum | 19.1% | 21.9% |
| Range | 18.1% | 20.8% |
| Mean | 8.0% | 8.4% |
| Median | 7.9% | 8.1% |
| Interquartile 25% (IQ1) | 5.8% | 5.5% |
| Interquartile 75% (IQ3) | 9.7% | 10.6% |
| Interquartile Range (IQR) | 3.9% | 5.1% |
| Standard Deviation (Sample) | 3.7% | 3.9% |
| Standard Deviation (Population) | 3.6% | 3.9% |
Similar Demographics by Family Poverty
Demographics Similar to Chileans by Family Poverty
In terms of family poverty, the demographic groups most similar to Chileans are Sri Lankan (8.5%, a difference of 0.010%), Immigrants from Malaysia (8.5%, a difference of 0.040%), Immigrants from Brazil (8.5%, a difference of 0.080%), Immigrants from Southern Europe (8.5%, a difference of 0.16%), and Immigrants from Argentina (8.4%, a difference of 0.51%).
| Demographics | Rating | Rank | Family Poverty |
| Immigrants | Hungary | 89.9 /100 | #127 | Excellent 8.4% |
| Argentineans | 89.6 /100 | #128 | Excellent 8.4% |
| Portuguese | 89.2 /100 | #129 | Excellent 8.4% |
| Immigrants | Bosnia and Herzegovina | 88.6 /100 | #130 | Excellent 8.4% |
| Puget Sound Salish | 88.6 /100 | #131 | Excellent 8.4% |
| Immigrants | Argentina | 88.2 /100 | #132 | Excellent 8.4% |
| Sri Lankans | 86.6 /100 | #133 | Excellent 8.5% |
| Chileans | 86.6 /100 | #134 | Excellent 8.5% |
| Immigrants | Malaysia | 86.5 /100 | #135 | Excellent 8.5% |
| Immigrants | Brazil | 86.3 /100 | #136 | Excellent 8.5% |
| Immigrants | Southern Europe | 86.0 /100 | #137 | Excellent 8.5% |
| Armenians | 84.6 /100 | #138 | Excellent 8.5% |
| Immigrants | Nepal | 84.2 /100 | #139 | Excellent 8.5% |
| Immigrants | Kazakhstan | 84.1 /100 | #140 | Excellent 8.5% |
| Immigrants | Ukraine | 83.9 /100 | #141 | Excellent 8.5% |
Demographics Similar to Immigrants from Sierra Leone by Family Poverty
In terms of family poverty, the demographic groups most similar to Immigrants from Sierra Leone are German Russian (9.4%, a difference of 0.040%), Immigrants from Lebanon (9.4%, a difference of 0.14%), Immigrants from Portugal (9.4%, a difference of 0.17%), Aleut (9.5%, a difference of 0.33%), and Immigrants from South America (9.5%, a difference of 0.34%).
| Demographics | Rating | Rank | Family Poverty |
| Venezuelans | 27.4 /100 | #195 | Fair 9.3% |
| Immigrants | Venezuela | 26.1 /100 | #196 | Fair 9.3% |
| Immigrants | Colombia | 24.4 /100 | #197 | Fair 9.3% |
| Iraqis | 24.2 /100 | #198 | Fair 9.3% |
| Spaniards | 22.8 /100 | #199 | Fair 9.4% |
| Immigrants | Costa Rica | 21.7 /100 | #200 | Fair 9.4% |
| Immigrants | Portugal | 20.5 /100 | #201 | Fair 9.4% |
| Immigrants | Sierra Leone | 19.6 /100 | #202 | Poor 9.4% |
| German Russians | 19.4 /100 | #203 | Poor 9.4% |
| Immigrants | Lebanon | 18.9 /100 | #204 | Poor 9.4% |
| Aleuts | 18.0 /100 | #205 | Poor 9.5% |
| Immigrants | South America | 18.0 /100 | #206 | Poor 9.5% |
| Sierra Leoneans | 15.6 /100 | #207 | Poor 9.5% |
| Immigrants | Eastern Africa | 15.1 /100 | #208 | Poor 9.5% |
| Immigrants | Uruguay | 14.0 /100 | #209 | Poor 9.5% |