German Russian vs Immigrants from Sudan Female Poverty Among 18-24 Year Olds
COMPARE
German Russian
Immigrants from Sudan
Female Poverty Among 18-24 Year Olds
Female Poverty Among 18-24 Year Olds Comparison
German Russians
Immigrants from Sudan
25.2%
FEMALE POVERTY AMONG 18-24 YEAR OLDS
0.0/ 100
METRIC RATING
324th/ 347
METRIC RANK
23.5%
FEMALE POVERTY AMONG 18-24 YEAR OLDS
0.0/ 100
METRIC RATING
308th/ 347
METRIC RANK
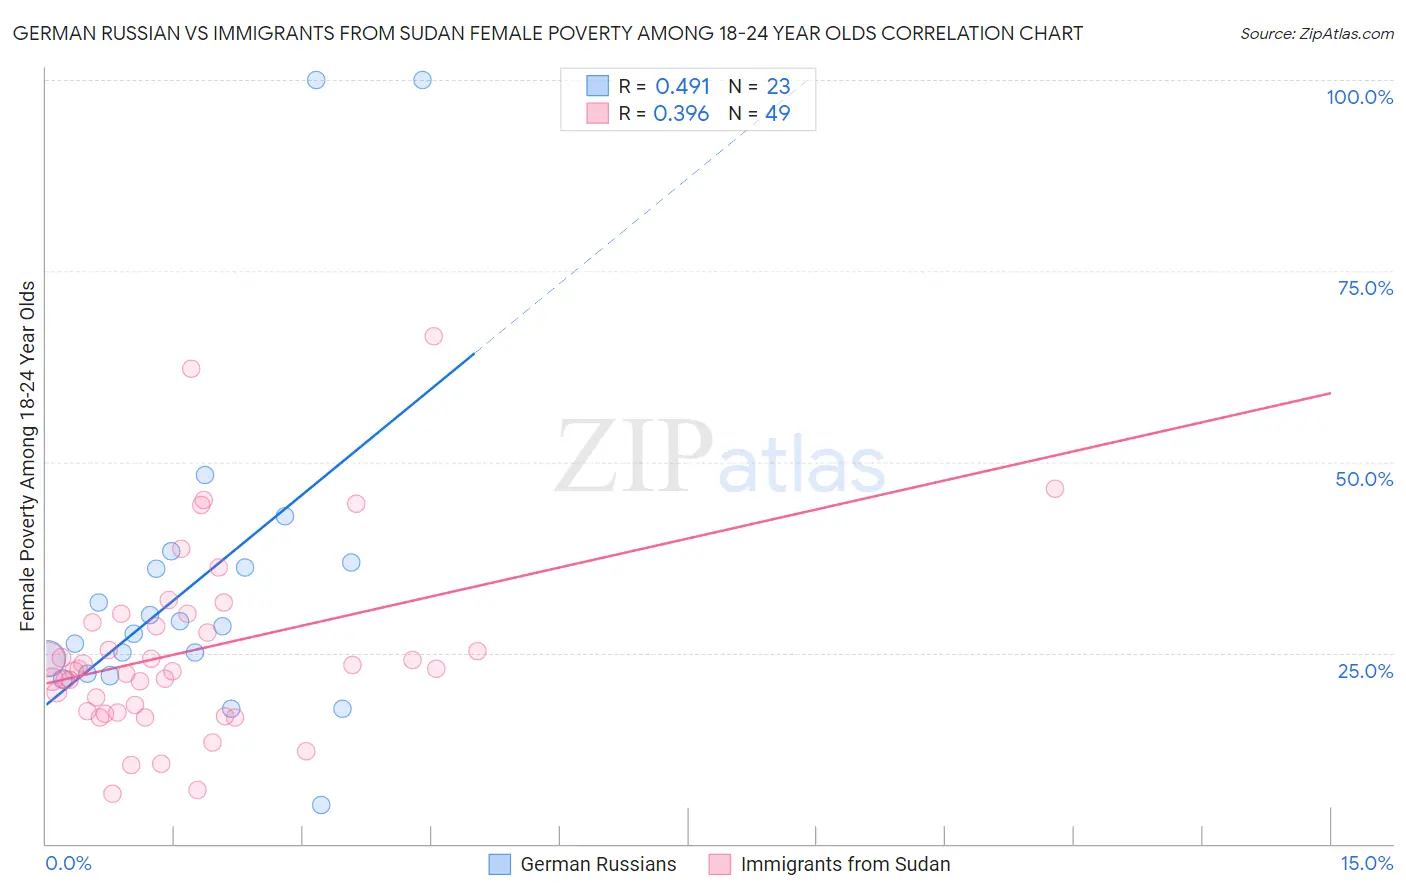
German Russian vs Immigrants from Sudan Female Poverty Among 18-24 Year Olds Correlation Chart
The statistical analysis conducted on geographies consisting of 95,759,293 people shows a moderate positive correlation between the proportion of German Russians and poverty level among females between the ages 18 and 24 in the United States with a correlation coefficient (R) of 0.491 and weighted average of 25.2%. Similarly, the statistical analysis conducted on geographies consisting of 118,546,695 people shows a mild positive correlation between the proportion of Immigrants from Sudan and poverty level among females between the ages 18 and 24 in the United States with a correlation coefficient (R) of 0.396 and weighted average of 23.5%, a difference of 7.1%.
Female Poverty Among 18-24 Year Olds Correlation Summary
| Measurement | German Russian | Immigrants from Sudan |
| Minimum | 5.0% | 6.5% |
| Maximum | 100.0% | 66.5% |
| Range | 95.0% | 59.9% |
| Mean | 34.4% | 25.4% |
| Median | 28.4% | 22.9% |
| Interquartile 25% (IQ1) | 22.3% | 17.3% |
| Interquartile 75% (IQ3) | 36.9% | 29.6% |
| Interquartile Range (IQR) | 14.6% | 12.3% |
| Standard Deviation (Sample) | 22.6% | 12.3% |
| Standard Deviation (Population) | 22.1% | 12.2% |
Demographics Similar to German Russians and Immigrants from Sudan by Female Poverty Among 18-24 Year Olds
In terms of female poverty among 18-24 year olds, the demographic groups most similar to German Russians are Arapaho (25.2%, a difference of 0.030%), Somali (25.1%, a difference of 0.10%), Immigrants from Zaire (25.1%, a difference of 0.40%), Immigrants from Saudi Arabia (25.3%, a difference of 0.43%), and Yakama (25.3%, a difference of 0.68%). Similarly, the demographic groups most similar to Immigrants from Sudan are Cree (23.4%, a difference of 0.35%), Blackfeet (23.6%, a difference of 0.45%), Comanche (23.6%, a difference of 0.50%), Potawatomi (23.7%, a difference of 0.79%), and Paiute (23.3%, a difference of 0.94%).
| Demographics | Rating | Rank | Female Poverty Among 18-24 Year Olds |
| Paiute | 0.0 /100 | #306 | Tragic 23.3% |
| Cree | 0.0 /100 | #307 | Tragic 23.4% |
| Immigrants | Sudan | 0.0 /100 | #308 | Tragic 23.5% |
| Blackfeet | 0.0 /100 | #309 | Tragic 23.6% |
| Comanche | 0.0 /100 | #310 | Tragic 23.6% |
| Potawatomi | 0.0 /100 | #311 | Tragic 23.7% |
| Yuman | 0.0 /100 | #312 | Tragic 24.0% |
| Creek | 0.0 /100 | #313 | Tragic 24.2% |
| Choctaw | 0.0 /100 | #314 | Tragic 24.3% |
| Blacks/African Americans | 0.0 /100 | #315 | Tragic 24.3% |
| Alsatians | 0.0 /100 | #316 | Tragic 24.4% |
| Osage | 0.0 /100 | #317 | Tragic 24.5% |
| Chickasaw | 0.0 /100 | #318 | Tragic 24.5% |
| Dutch West Indians | 0.0 /100 | #319 | Tragic 24.5% |
| Immigrants | Congo | 0.0 /100 | #320 | Tragic 24.6% |
| Immigrants | Zaire | 0.0 /100 | #321 | Tragic 25.1% |
| Somalis | 0.0 /100 | #322 | Tragic 25.1% |
| Arapaho | 0.0 /100 | #323 | Tragic 25.2% |
| German Russians | 0.0 /100 | #324 | Tragic 25.2% |
| Immigrants | Saudi Arabia | 0.0 /100 | #325 | Tragic 25.3% |
| Yakama | 0.0 /100 | #326 | Tragic 25.3% |