Cheyenne vs Afghan Female Poverty Among 18-24 Year Olds
COMPARE
Cheyenne
Afghan
Female Poverty Among 18-24 Year Olds
Female Poverty Among 18-24 Year Olds Comparison
Cheyenne
Afghans
28.1%
FEMALE POVERTY AMONG 18-24 YEAR OLDS
0.0/ 100
METRIC RATING
337th/ 347
METRIC RANK
19.0%
FEMALE POVERTY AMONG 18-24 YEAR OLDS
99.0/ 100
METRIC RATING
90th/ 347
METRIC RANK
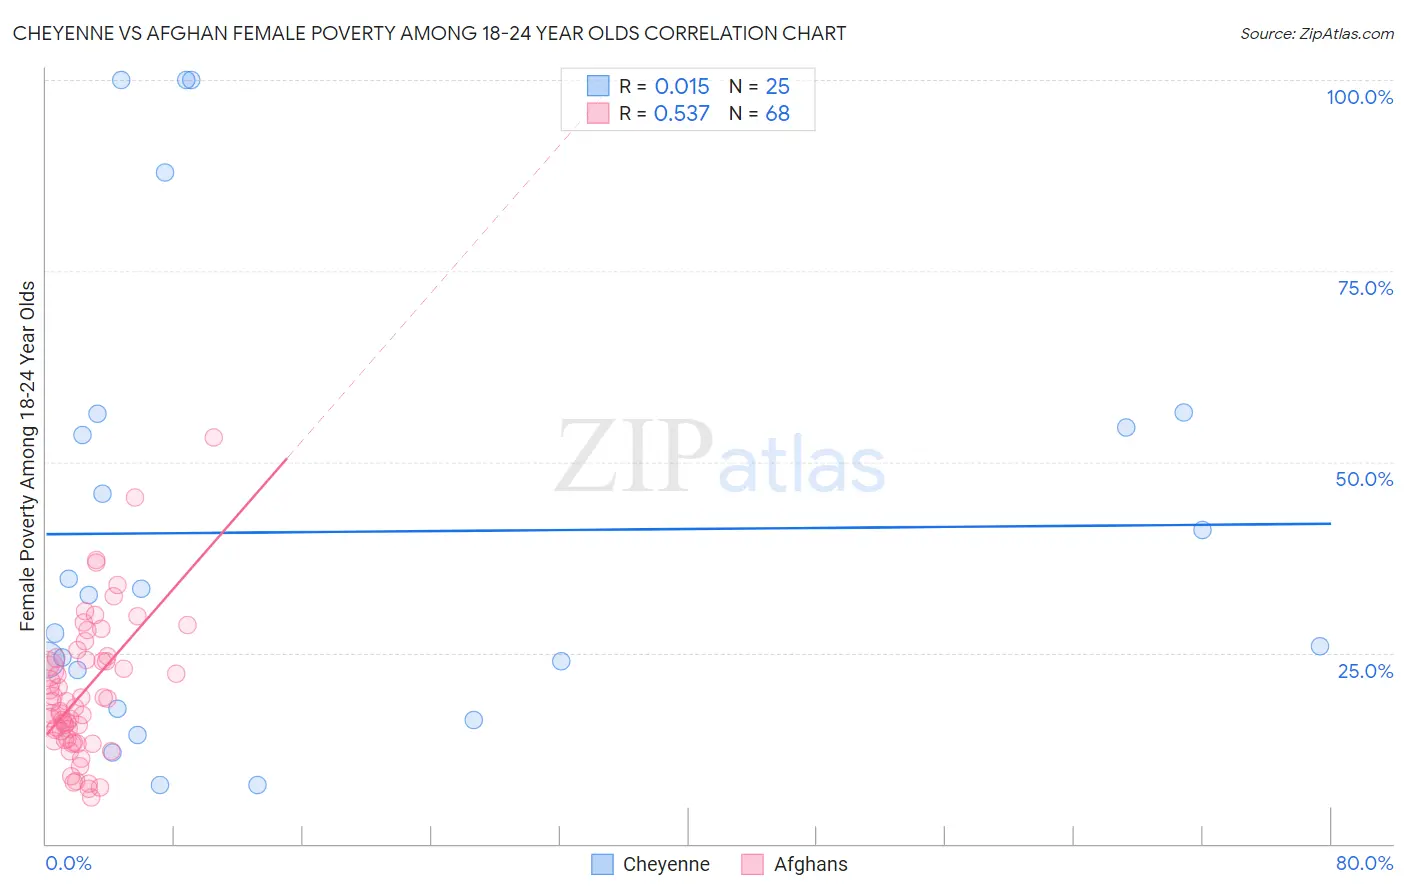
Cheyenne vs Afghan Female Poverty Among 18-24 Year Olds Correlation Chart
The statistical analysis conducted on geographies consisting of 80,212,982 people shows no correlation between the proportion of Cheyenne and poverty level among females between the ages 18 and 24 in the United States with a correlation coefficient (R) of 0.015 and weighted average of 28.1%. Similarly, the statistical analysis conducted on geographies consisting of 147,837,560 people shows a substantial positive correlation between the proportion of Afghans and poverty level among females between the ages 18 and 24 in the United States with a correlation coefficient (R) of 0.537 and weighted average of 19.0%, a difference of 48.4%.
Female Poverty Among 18-24 Year Olds Correlation Summary
| Measurement | Cheyenne | Afghan |
| Minimum | 7.7% | 6.1% |
| Maximum | 100.0% | 53.1% |
| Range | 92.3% | 47.0% |
| Mean | 40.8% | 19.9% |
| Median | 32.6% | 18.2% |
| Interquartile 25% (IQ1) | 20.2% | 13.6% |
| Interquartile 75% (IQ3) | 55.5% | 24.2% |
| Interquartile Range (IQR) | 35.2% | 10.5% |
| Standard Deviation (Sample) | 29.0% | 9.0% |
| Standard Deviation (Population) | 28.4% | 8.9% |
Similar Demographics by Female Poverty Among 18-24 Year Olds
Demographics Similar to Cheyenne by Female Poverty Among 18-24 Year Olds
In terms of female poverty among 18-24 year olds, the demographic groups most similar to Cheyenne are Hopi (28.2%, a difference of 0.21%), Pima (28.4%, a difference of 0.94%), Sioux (28.6%, a difference of 1.5%), Immigrants from Yemen (27.5%, a difference of 2.2%), and Colville (29.0%, a difference of 3.1%).
| Demographics | Rating | Rank | Female Poverty Among 18-24 Year Olds |
| Immigrants | Somalia | 0.0 /100 | #330 | Tragic 25.7% |
| Chippewa | 0.0 /100 | #331 | Tragic 25.9% |
| Houma | 0.0 /100 | #332 | Tragic 26.2% |
| Apache | 0.0 /100 | #333 | Tragic 26.3% |
| Pueblo | 0.0 /100 | #334 | Tragic 26.9% |
| Yup'ik | 0.0 /100 | #335 | Tragic 27.0% |
| Immigrants | Yemen | 0.0 /100 | #336 | Tragic 27.5% |
| Cheyenne | 0.0 /100 | #337 | Tragic 28.1% |
| Hopi | 0.0 /100 | #338 | Tragic 28.2% |
| Pima | 0.0 /100 | #339 | Tragic 28.4% |
| Sioux | 0.0 /100 | #340 | Tragic 28.6% |
| Colville | 0.0 /100 | #341 | Tragic 29.0% |
| Kiowa | 0.0 /100 | #342 | Tragic 29.2% |
| Puerto Ricans | 0.0 /100 | #343 | Tragic 29.8% |
| Navajo | 0.0 /100 | #344 | Tragic 30.3% |
Demographics Similar to Afghans by Female Poverty Among 18-24 Year Olds
In terms of female poverty among 18-24 year olds, the demographic groups most similar to Afghans are Immigrants from Cabo Verde (19.0%, a difference of 0.030%), Croatian (19.0%, a difference of 0.050%), Romanian (19.0%, a difference of 0.090%), Filipino (19.0%, a difference of 0.14%), and Haitian (19.0%, a difference of 0.17%).
| Demographics | Rating | Rank | Female Poverty Among 18-24 Year Olds |
| Immigrants | Indonesia | 99.4 /100 | #83 | Exceptional 18.9% |
| Burmese | 99.2 /100 | #84 | Exceptional 18.9% |
| Immigrants | Armenia | 99.2 /100 | #85 | Exceptional 18.9% |
| Immigrants | Iraq | 99.2 /100 | #86 | Exceptional 18.9% |
| Immigrants | Jamaica | 99.2 /100 | #87 | Exceptional 18.9% |
| Croatians | 99.1 /100 | #88 | Exceptional 19.0% |
| Immigrants | Cabo Verde | 99.0 /100 | #89 | Exceptional 19.0% |
| Afghans | 99.0 /100 | #90 | Exceptional 19.0% |
| Romanians | 98.9 /100 | #91 | Exceptional 19.0% |
| Filipinos | 98.9 /100 | #92 | Exceptional 19.0% |
| Haitians | 98.9 /100 | #93 | Exceptional 19.0% |
| Ukrainians | 98.8 /100 | #94 | Exceptional 19.0% |
| Guamanians/Chamorros | 98.8 /100 | #95 | Exceptional 19.0% |
| Sierra Leoneans | 98.7 /100 | #96 | Exceptional 19.0% |
| Salvadorans | 98.4 /100 | #97 | Exceptional 19.1% |