Cheyenne vs Yakama Female Poverty Among 18-24 Year Olds
COMPARE
Cheyenne
Yakama
Female Poverty Among 18-24 Year Olds
Female Poverty Among 18-24 Year Olds Comparison
Cheyenne
Yakama
28.1%
FEMALE POVERTY AMONG 18-24 YEAR OLDS
0.0/ 100
METRIC RATING
337th/ 347
METRIC RANK
25.3%
FEMALE POVERTY AMONG 18-24 YEAR OLDS
0.0/ 100
METRIC RATING
326th/ 347
METRIC RANK
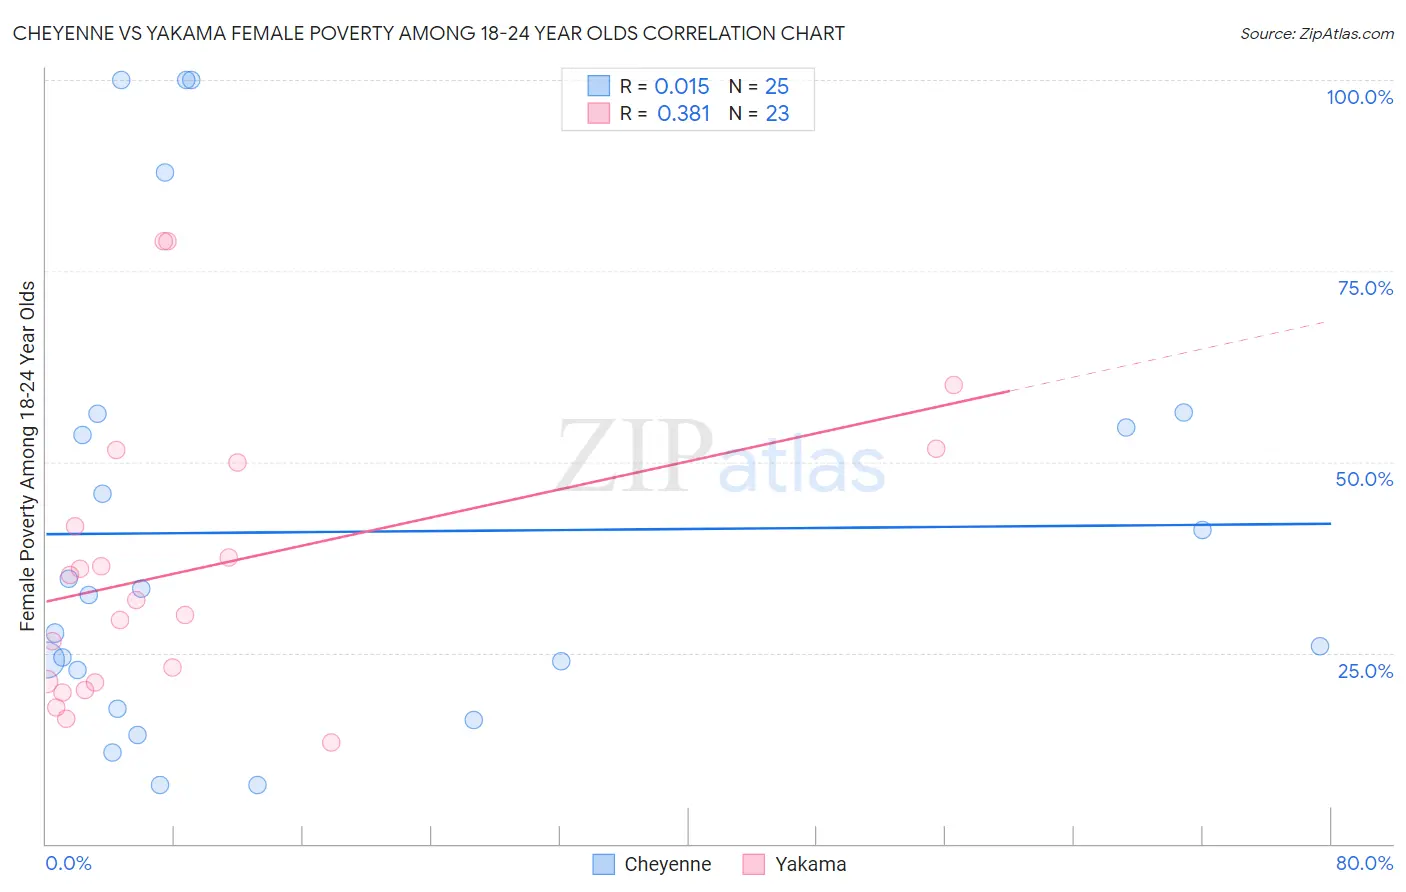
Cheyenne vs Yakama Female Poverty Among 18-24 Year Olds Correlation Chart
The statistical analysis conducted on geographies consisting of 80,212,982 people shows no correlation between the proportion of Cheyenne and poverty level among females between the ages 18 and 24 in the United States with a correlation coefficient (R) of 0.015 and weighted average of 28.1%. Similarly, the statistical analysis conducted on geographies consisting of 19,755,262 people shows a mild positive correlation between the proportion of Yakama and poverty level among females between the ages 18 and 24 in the United States with a correlation coefficient (R) of 0.381 and weighted average of 25.3%, a difference of 11.1%.
Female Poverty Among 18-24 Year Olds Correlation Summary
| Measurement | Cheyenne | Yakama |
| Minimum | 7.7% | 13.3% |
| Maximum | 100.0% | 78.9% |
| Range | 92.3% | 65.6% |
| Mean | 40.8% | 36.0% |
| Median | 32.6% | 31.9% |
| Interquartile 25% (IQ1) | 20.2% | 21.1% |
| Interquartile 75% (IQ3) | 55.5% | 50.0% |
| Interquartile Range (IQR) | 35.2% | 28.9% |
| Standard Deviation (Sample) | 29.0% | 18.5% |
| Standard Deviation (Population) | 28.4% | 18.1% |
Demographics Similar to Cheyenne and Yakama by Female Poverty Among 18-24 Year Olds
In terms of female poverty among 18-24 year olds, the demographic groups most similar to Cheyenne are Hopi (28.2%, a difference of 0.21%), Pima (28.4%, a difference of 0.94%), Sioux (28.6%, a difference of 1.5%), Immigrants from Yemen (27.5%, a difference of 2.2%), and Colville (29.0%, a difference of 3.1%). Similarly, the demographic groups most similar to Yakama are Ute (25.4%, a difference of 0.23%), Immigrants from Saudi Arabia (25.3%, a difference of 0.25%), Native/Alaskan (25.4%, a difference of 0.29%), German Russian (25.2%, a difference of 0.68%), and Arapaho (25.2%, a difference of 0.71%).
| Demographics | Rating | Rank | Female Poverty Among 18-24 Year Olds |
| Immigrants | Zaire | 0.0 /100 | #321 | Tragic 25.1% |
| Somalis | 0.0 /100 | #322 | Tragic 25.1% |
| Arapaho | 0.0 /100 | #323 | Tragic 25.2% |
| German Russians | 0.0 /100 | #324 | Tragic 25.2% |
| Immigrants | Saudi Arabia | 0.0 /100 | #325 | Tragic 25.3% |
| Yakama | 0.0 /100 | #326 | Tragic 25.3% |
| Ute | 0.0 /100 | #327 | Tragic 25.4% |
| Natives/Alaskans | 0.0 /100 | #328 | Tragic 25.4% |
| Cajuns | 0.0 /100 | #329 | Tragic 25.7% |
| Immigrants | Somalia | 0.0 /100 | #330 | Tragic 25.7% |
| Chippewa | 0.0 /100 | #331 | Tragic 25.9% |
| Houma | 0.0 /100 | #332 | Tragic 26.2% |
| Apache | 0.0 /100 | #333 | Tragic 26.3% |
| Pueblo | 0.0 /100 | #334 | Tragic 26.9% |
| Yup'ik | 0.0 /100 | #335 | Tragic 27.0% |
| Immigrants | Yemen | 0.0 /100 | #336 | Tragic 27.5% |
| Cheyenne | 0.0 /100 | #337 | Tragic 28.1% |
| Hopi | 0.0 /100 | #338 | Tragic 28.2% |
| Pima | 0.0 /100 | #339 | Tragic 28.4% |
| Sioux | 0.0 /100 | #340 | Tragic 28.6% |
| Colville | 0.0 /100 | #341 | Tragic 29.0% |