Cheyenne vs Immigrants from South America Female Poverty Among 18-24 Year Olds
COMPARE
Cheyenne
Immigrants from South America
Female Poverty Among 18-24 Year Olds
Female Poverty Among 18-24 Year Olds Comparison
Cheyenne
Immigrants from South America
28.1%
FEMALE POVERTY AMONG 18-24 YEAR OLDS
0.0/ 100
METRIC RATING
337th/ 347
METRIC RANK
17.9%
FEMALE POVERTY AMONG 18-24 YEAR OLDS
100.0/ 100
METRIC RATING
36th/ 347
METRIC RANK
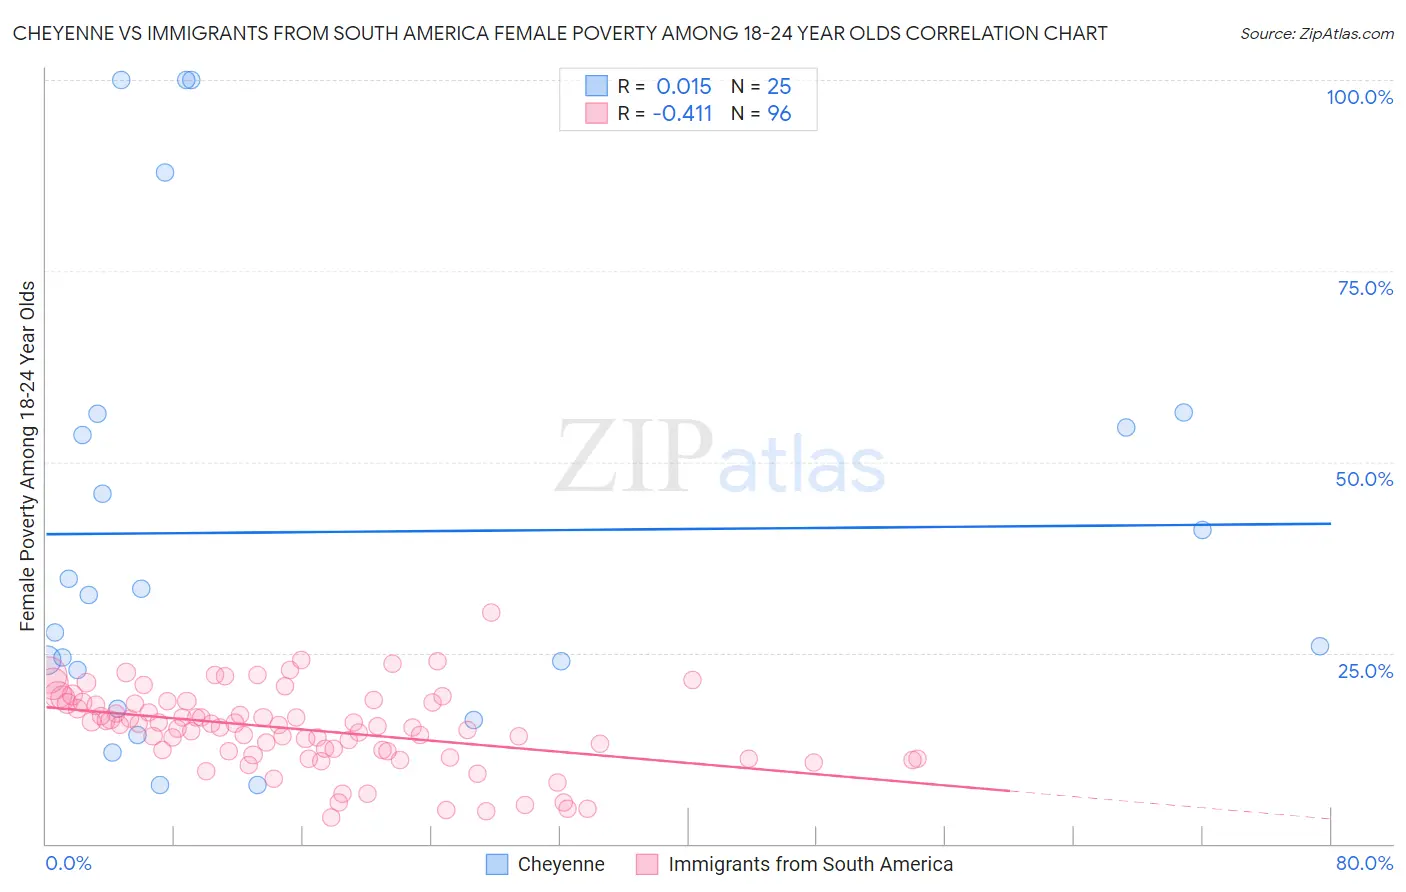
Cheyenne vs Immigrants from South America Female Poverty Among 18-24 Year Olds Correlation Chart
The statistical analysis conducted on geographies consisting of 80,212,982 people shows no correlation between the proportion of Cheyenne and poverty level among females between the ages 18 and 24 in the United States with a correlation coefficient (R) of 0.015 and weighted average of 28.1%. Similarly, the statistical analysis conducted on geographies consisting of 468,818,537 people shows a moderate negative correlation between the proportion of Immigrants from South America and poverty level among females between the ages 18 and 24 in the United States with a correlation coefficient (R) of -0.411 and weighted average of 17.9%, a difference of 57.2%.
Female Poverty Among 18-24 Year Olds Correlation Summary
| Measurement | Cheyenne | Immigrants from South America |
| Minimum | 7.7% | 3.5% |
| Maximum | 100.0% | 30.2% |
| Range | 92.3% | 26.7% |
| Mean | 40.8% | 15.0% |
| Median | 32.6% | 15.5% |
| Interquartile 25% (IQ1) | 20.2% | 11.9% |
| Interquartile 75% (IQ3) | 55.5% | 18.4% |
| Interquartile Range (IQR) | 35.2% | 6.5% |
| Standard Deviation (Sample) | 29.0% | 5.2% |
| Standard Deviation (Population) | 28.4% | 5.2% |
Similar Demographics by Female Poverty Among 18-24 Year Olds
Demographics Similar to Cheyenne by Female Poverty Among 18-24 Year Olds
In terms of female poverty among 18-24 year olds, the demographic groups most similar to Cheyenne are Hopi (28.2%, a difference of 0.21%), Pima (28.4%, a difference of 0.94%), Sioux (28.6%, a difference of 1.5%), Immigrants from Yemen (27.5%, a difference of 2.2%), and Colville (29.0%, a difference of 3.1%).
| Demographics | Rating | Rank | Female Poverty Among 18-24 Year Olds |
| Immigrants | Somalia | 0.0 /100 | #330 | Tragic 25.7% |
| Chippewa | 0.0 /100 | #331 | Tragic 25.9% |
| Houma | 0.0 /100 | #332 | Tragic 26.2% |
| Apache | 0.0 /100 | #333 | Tragic 26.3% |
| Pueblo | 0.0 /100 | #334 | Tragic 26.9% |
| Yup'ik | 0.0 /100 | #335 | Tragic 27.0% |
| Immigrants | Yemen | 0.0 /100 | #336 | Tragic 27.5% |
| Cheyenne | 0.0 /100 | #337 | Tragic 28.1% |
| Hopi | 0.0 /100 | #338 | Tragic 28.2% |
| Pima | 0.0 /100 | #339 | Tragic 28.4% |
| Sioux | 0.0 /100 | #340 | Tragic 28.6% |
| Colville | 0.0 /100 | #341 | Tragic 29.0% |
| Kiowa | 0.0 /100 | #342 | Tragic 29.2% |
| Puerto Ricans | 0.0 /100 | #343 | Tragic 29.8% |
| Navajo | 0.0 /100 | #344 | Tragic 30.3% |
Demographics Similar to Immigrants from South America by Female Poverty Among 18-24 Year Olds
In terms of female poverty among 18-24 year olds, the demographic groups most similar to Immigrants from South America are Immigrants from Greece (17.9%, a difference of 0.050%), Immigrants from Croatia (17.9%, a difference of 0.060%), Immigrants from Nicaragua (17.9%, a difference of 0.090%), Native Hawaiian (17.9%, a difference of 0.20%), and Immigrants from Moldova (17.9%, a difference of 0.23%).
| Demographics | Rating | Rank | Female Poverty Among 18-24 Year Olds |
| Portuguese | 100.0 /100 | #29 | Exceptional 17.8% |
| Immigrants | South Eastern Asia | 100.0 /100 | #30 | Exceptional 17.8% |
| Immigrants | Vietnam | 100.0 /100 | #31 | Exceptional 17.8% |
| Immigrants | Moldova | 100.0 /100 | #32 | Exceptional 17.9% |
| Native Hawaiians | 100.0 /100 | #33 | Exceptional 17.9% |
| Immigrants | Nicaragua | 100.0 /100 | #34 | Exceptional 17.9% |
| Immigrants | Greece | 100.0 /100 | #35 | Exceptional 17.9% |
| Immigrants | South America | 100.0 /100 | #36 | Exceptional 17.9% |
| Immigrants | Croatia | 100.0 /100 | #37 | Exceptional 17.9% |
| South Americans | 100.0 /100 | #38 | Exceptional 18.0% |
| Puget Sound Salish | 100.0 /100 | #39 | Exceptional 18.0% |
| Immigrants | Romania | 100.0 /100 | #40 | Exceptional 18.0% |
| Immigrants | Argentina | 100.0 /100 | #41 | Exceptional 18.0% |
| Bulgarians | 100.0 /100 | #42 | Exceptional 18.1% |
| Macedonians | 100.0 /100 | #43 | Exceptional 18.1% |