Immigrants from Hong Kong vs Immigrants from Sudan Female Poverty Among 18-24 Year Olds
COMPARE
Immigrants from Hong Kong
Immigrants from Sudan
Female Poverty Among 18-24 Year Olds
Female Poverty Among 18-24 Year Olds Comparison
Immigrants from Hong Kong
Immigrants from Sudan
17.5%
FEMALE POVERTY AMONG 18-24 YEAR OLDS
100.0/ 100
METRIC RATING
22nd/ 347
METRIC RANK
23.5%
FEMALE POVERTY AMONG 18-24 YEAR OLDS
0.0/ 100
METRIC RATING
308th/ 347
METRIC RANK
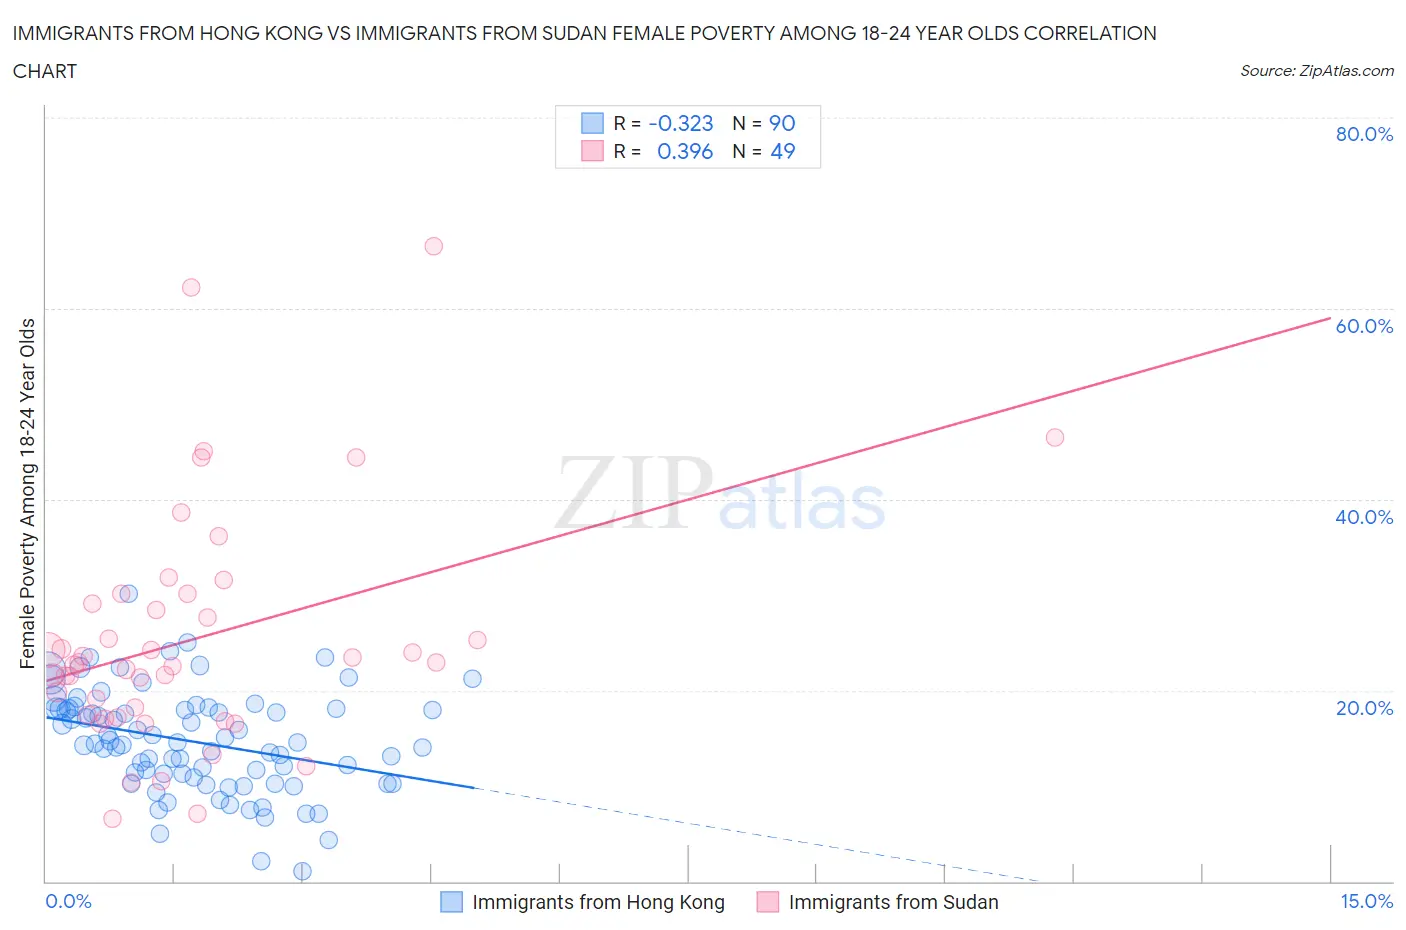
Immigrants from Hong Kong vs Immigrants from Sudan Female Poverty Among 18-24 Year Olds Correlation Chart
The statistical analysis conducted on geographies consisting of 249,802,041 people shows a mild negative correlation between the proportion of Immigrants from Hong Kong and poverty level among females between the ages 18 and 24 in the United States with a correlation coefficient (R) of -0.323 and weighted average of 17.5%. Similarly, the statistical analysis conducted on geographies consisting of 118,546,695 people shows a mild positive correlation between the proportion of Immigrants from Sudan and poverty level among females between the ages 18 and 24 in the United States with a correlation coefficient (R) of 0.396 and weighted average of 23.5%, a difference of 34.7%.
Female Poverty Among 18-24 Year Olds Correlation Summary
| Measurement | Immigrants from Hong Kong | Immigrants from Sudan |
| Minimum | 1.0% | 6.5% |
| Maximum | 30.1% | 66.5% |
| Range | 29.0% | 59.9% |
| Mean | 14.6% | 25.4% |
| Median | 14.5% | 22.9% |
| Interquartile 25% (IQ1) | 10.9% | 17.3% |
| Interquartile 75% (IQ3) | 18.1% | 29.6% |
| Interquartile Range (IQR) | 7.2% | 12.3% |
| Standard Deviation (Sample) | 5.4% | 12.3% |
| Standard Deviation (Population) | 5.3% | 12.2% |
Similar Demographics by Female Poverty Among 18-24 Year Olds
Demographics Similar to Immigrants from Hong Kong by Female Poverty Among 18-24 Year Olds
In terms of female poverty among 18-24 year olds, the demographic groups most similar to Immigrants from Hong Kong are Immigrants from Venezuela (17.4%, a difference of 0.10%), Bolivian (17.4%, a difference of 0.10%), Immigrants from Lithuania (17.4%, a difference of 0.23%), Immigrants from North Macedonia (17.6%, a difference of 0.56%), and Maltese (17.6%, a difference of 0.63%).
| Demographics | Rating | Rank | Female Poverty Among 18-24 Year Olds |
| Cubans | 100.0 /100 | #15 | Exceptional 17.2% |
| Peruvians | 100.0 /100 | #16 | Exceptional 17.2% |
| Immigrants | Taiwan | 100.0 /100 | #17 | Exceptional 17.3% |
| Immigrants | Colombia | 100.0 /100 | #18 | Exceptional 17.3% |
| Immigrants | Lithuania | 100.0 /100 | #19 | Exceptional 17.4% |
| Immigrants | Venezuela | 100.0 /100 | #20 | Exceptional 17.4% |
| Bolivians | 100.0 /100 | #21 | Exceptional 17.4% |
| Immigrants | Hong Kong | 100.0 /100 | #22 | Exceptional 17.5% |
| Immigrants | North Macedonia | 100.0 /100 | #23 | Exceptional 17.6% |
| Maltese | 100.0 /100 | #24 | Exceptional 17.6% |
| Immigrants | South Central Asia | 100.0 /100 | #25 | Exceptional 17.6% |
| Immigrants | Fiji | 100.0 /100 | #26 | Exceptional 17.7% |
| Colombians | 100.0 /100 | #27 | Exceptional 17.7% |
| Venezuelans | 100.0 /100 | #28 | Exceptional 17.7% |
| Portuguese | 100.0 /100 | #29 | Exceptional 17.8% |
Demographics Similar to Immigrants from Sudan by Female Poverty Among 18-24 Year Olds
In terms of female poverty among 18-24 year olds, the demographic groups most similar to Immigrants from Sudan are Cree (23.4%, a difference of 0.35%), Blackfeet (23.6%, a difference of 0.45%), Comanche (23.6%, a difference of 0.50%), Potawatomi (23.7%, a difference of 0.79%), and Paiute (23.3%, a difference of 0.94%).
| Demographics | Rating | Rank | Female Poverty Among 18-24 Year Olds |
| Seminole | 0.0 /100 | #301 | Tragic 22.9% |
| Iroquois | 0.0 /100 | #302 | Tragic 22.9% |
| Senegalese | 0.0 /100 | #303 | Tragic 23.0% |
| Sudanese | 0.0 /100 | #304 | Tragic 23.0% |
| Immigrants | Kuwait | 0.0 /100 | #305 | Tragic 23.0% |
| Paiute | 0.0 /100 | #306 | Tragic 23.3% |
| Cree | 0.0 /100 | #307 | Tragic 23.4% |
| Immigrants | Sudan | 0.0 /100 | #308 | Tragic 23.5% |
| Blackfeet | 0.0 /100 | #309 | Tragic 23.6% |
| Comanche | 0.0 /100 | #310 | Tragic 23.6% |
| Potawatomi | 0.0 /100 | #311 | Tragic 23.7% |
| Yuman | 0.0 /100 | #312 | Tragic 24.0% |
| Creek | 0.0 /100 | #313 | Tragic 24.2% |
| Choctaw | 0.0 /100 | #314 | Tragic 24.3% |
| Blacks/African Americans | 0.0 /100 | #315 | Tragic 24.3% |