Cheyenne vs Immigrants from Pakistan Family Poverty
COMPARE
Cheyenne
Immigrants from Pakistan
Family Poverty
Family Poverty Comparison
Cheyenne
Immigrants from Pakistan
14.3%
FAMILY POVERTY
0.0/ 100
METRIC RATING
331st/ 347
METRIC RANK
8.0%
FAMILY POVERTY
96.6/ 100
METRIC RATING
94th/ 347
METRIC RANK
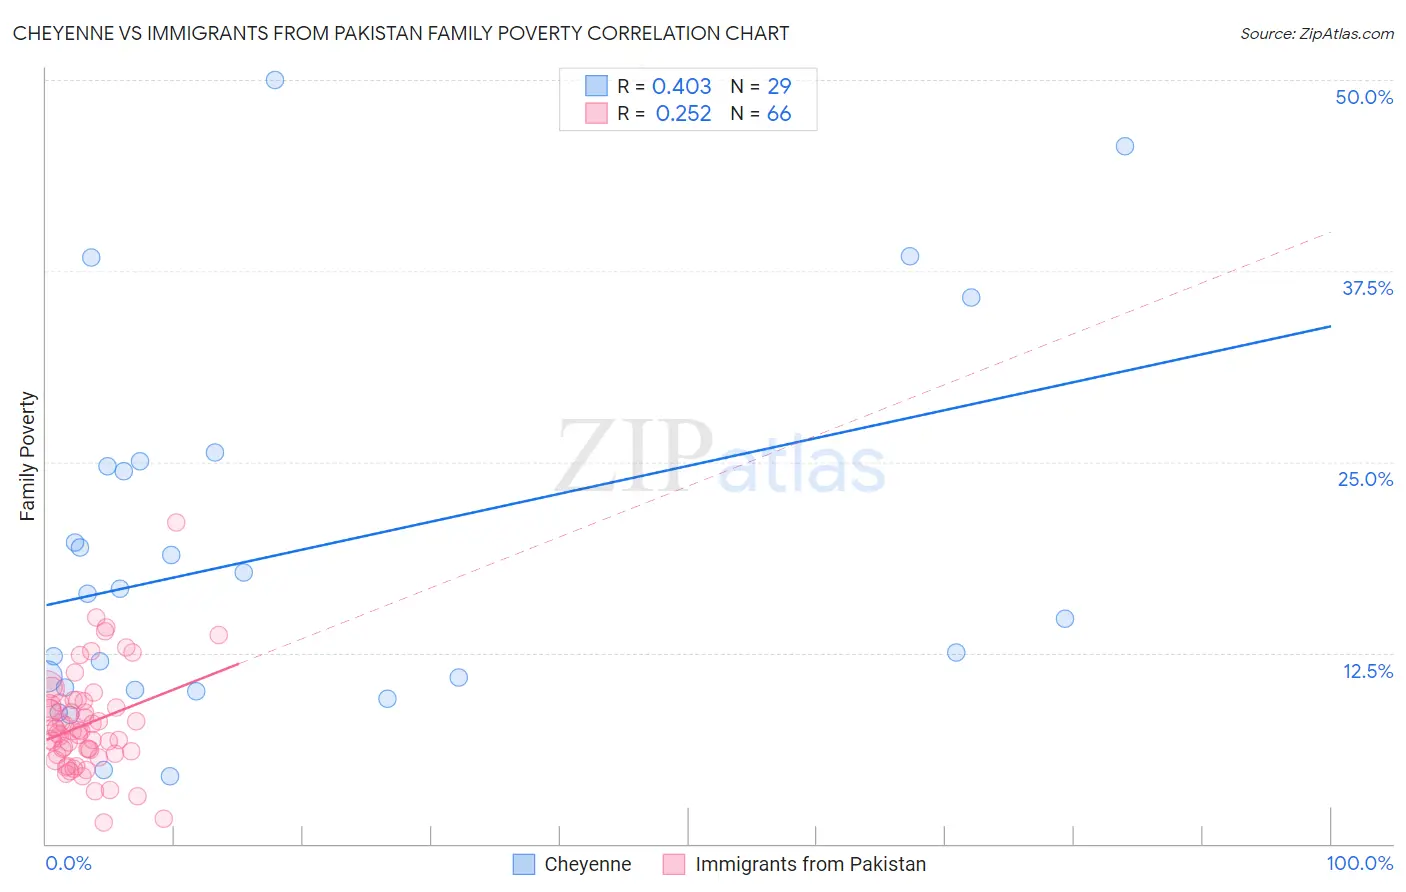
Cheyenne vs Immigrants from Pakistan Family Poverty Correlation Chart
The statistical analysis conducted on geographies consisting of 80,652,371 people shows a moderate positive correlation between the proportion of Cheyenne and poverty level among families in the United States with a correlation coefficient (R) of 0.403 and weighted average of 14.3%. Similarly, the statistical analysis conducted on geographies consisting of 283,475,243 people shows a weak positive correlation between the proportion of Immigrants from Pakistan and poverty level among families in the United States with a correlation coefficient (R) of 0.252 and weighted average of 8.0%, a difference of 78.0%.
Family Poverty Correlation Summary
| Measurement | Cheyenne | Immigrants from Pakistan |
| Minimum | 4.4% | 1.4% |
| Maximum | 50.0% | 21.0% |
| Range | 45.6% | 19.6% |
| Mean | 19.2% | 7.8% |
| Median | 16.4% | 7.4% |
| Interquartile 25% (IQ1) | 10.1% | 5.9% |
| Interquartile 75% (IQ3) | 24.9% | 9.2% |
| Interquartile Range (IQR) | 14.7% | 3.3% |
| Standard Deviation (Sample) | 12.1% | 3.3% |
| Standard Deviation (Population) | 11.9% | 3.3% |
Similar Demographics by Family Poverty
Demographics Similar to Cheyenne by Family Poverty
In terms of family poverty, the demographic groups most similar to Cheyenne are Native/Alaskan (14.3%, a difference of 0.14%), Dominican (14.3%, a difference of 0.44%), Immigrants from Dominican Republic (14.4%, a difference of 1.1%), Houma (14.6%, a difference of 2.4%), and Apache (14.7%, a difference of 3.2%).
| Demographics | Rating | Rank | Family Poverty |
| Immigrants | Dominica | 0.0 /100 | #324 | Tragic 12.7% |
| Paiute | 0.0 /100 | #325 | Tragic 13.0% |
| Colville | 0.0 /100 | #326 | Tragic 13.0% |
| Yakama | 0.0 /100 | #327 | Tragic 13.1% |
| Central American Indians | 0.0 /100 | #328 | Tragic 13.3% |
| Blacks/African Americans | 0.0 /100 | #329 | Tragic 13.3% |
| Natives/Alaskans | 0.0 /100 | #330 | Tragic 14.3% |
| Cheyenne | 0.0 /100 | #331 | Tragic 14.3% |
| Dominicans | 0.0 /100 | #332 | Tragic 14.3% |
| Immigrants | Dominican Republic | 0.0 /100 | #333 | Tragic 14.4% |
| Houma | 0.0 /100 | #334 | Tragic 14.6% |
| Apache | 0.0 /100 | #335 | Tragic 14.7% |
| Sioux | 0.0 /100 | #336 | Tragic 15.9% |
| Hopi | 0.0 /100 | #337 | Tragic 15.9% |
| Crow | 0.0 /100 | #338 | Tragic 16.1% |
Demographics Similar to Immigrants from Pakistan by Family Poverty
In terms of family poverty, the demographic groups most similar to Immigrants from Pakistan are Immigrants from Philippines (8.0%, a difference of 0.010%), Immigrants from Turkey (8.0%, a difference of 0.030%), Tlingit-Haida (8.0%, a difference of 0.11%), Czechoslovakian (8.0%, a difference of 0.29%), and Immigrants from Switzerland (8.1%, a difference of 0.44%).
| Demographics | Rating | Rank | Family Poverty |
| Belgians | 97.3 /100 | #87 | Exceptional 8.0% |
| Serbians | 97.2 /100 | #88 | Exceptional 8.0% |
| Immigrants | Denmark | 97.1 /100 | #89 | Exceptional 8.0% |
| Immigrants | England | 97.1 /100 | #90 | Exceptional 8.0% |
| Immigrants | Italy | 97.0 /100 | #91 | Exceptional 8.0% |
| Czechoslovakians | 96.8 /100 | #92 | Exceptional 8.0% |
| Tlingit-Haida | 96.7 /100 | #93 | Exceptional 8.0% |
| Immigrants | Pakistan | 96.6 /100 | #94 | Exceptional 8.0% |
| Immigrants | Philippines | 96.5 /100 | #95 | Exceptional 8.0% |
| Immigrants | Turkey | 96.5 /100 | #96 | Exceptional 8.0% |
| Immigrants | Switzerland | 96.1 /100 | #97 | Exceptional 8.1% |
| Immigrants | South Africa | 95.9 /100 | #98 | Exceptional 8.1% |
| Welsh | 95.8 /100 | #99 | Exceptional 8.1% |
| New Zealanders | 95.8 /100 | #100 | Exceptional 8.1% |
| Immigrants | Norway | 95.7 /100 | #101 | Exceptional 8.1% |