Spanish vs Immigrants from Pakistan Family Poverty
COMPARE
Spanish
Immigrants from Pakistan
Family Poverty
Family Poverty Comparison
Spanish
Immigrants from Pakistan
9.3%
FAMILY POVERTY
28.7/ 100
METRIC RATING
192nd/ 347
METRIC RANK
8.0%
FAMILY POVERTY
96.6/ 100
METRIC RATING
94th/ 347
METRIC RANK
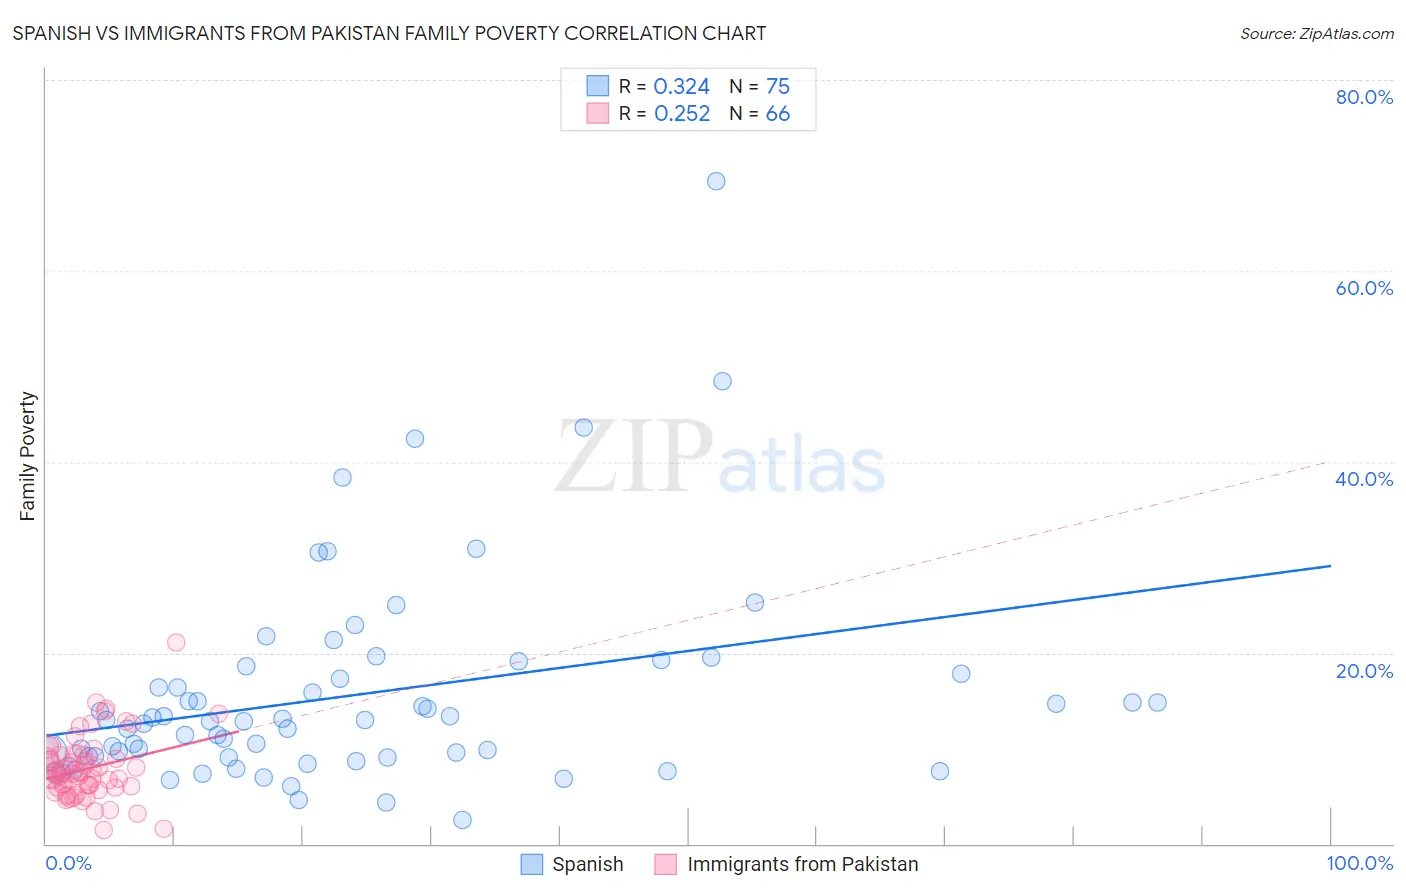
Spanish vs Immigrants from Pakistan Family Poverty Correlation Chart
The statistical analysis conducted on geographies consisting of 421,086,812 people shows a mild positive correlation between the proportion of Spanish and poverty level among families in the United States with a correlation coefficient (R) of 0.324 and weighted average of 9.3%. Similarly, the statistical analysis conducted on geographies consisting of 283,475,243 people shows a weak positive correlation between the proportion of Immigrants from Pakistan and poverty level among families in the United States with a correlation coefficient (R) of 0.252 and weighted average of 8.0%, a difference of 15.6%.
Family Poverty Correlation Summary
| Measurement | Spanish | Immigrants from Pakistan |
| Minimum | 2.5% | 1.4% |
| Maximum | 69.4% | 21.0% |
| Range | 66.9% | 19.6% |
| Mean | 15.5% | 7.8% |
| Median | 12.8% | 7.4% |
| Interquartile 25% (IQ1) | 9.0% | 5.9% |
| Interquartile 75% (IQ3) | 17.8% | 9.2% |
| Interquartile Range (IQR) | 8.8% | 3.3% |
| Standard Deviation (Sample) | 11.0% | 3.3% |
| Standard Deviation (Population) | 11.0% | 3.3% |
Similar Demographics by Family Poverty
Demographics Similar to Spanish by Family Poverty
In terms of family poverty, the demographic groups most similar to Spanish are Ugandan (9.3%, a difference of 0.010%), Immigrants from Western Asia (9.3%, a difference of 0.070%), South American (9.3%, a difference of 0.090%), Venezuelan (9.3%, a difference of 0.21%), and Arab (9.2%, a difference of 0.42%).
| Demographics | Rating | Rank | Family Poverty |
| Immigrants | Saudi Arabia | 38.6 /100 | #185 | Fair 9.1% |
| Colombians | 36.1 /100 | #186 | Fair 9.2% |
| Delaware | 35.4 /100 | #187 | Fair 9.2% |
| Immigrants | Kenya | 34.0 /100 | #188 | Fair 9.2% |
| Immigrants | Afghanistan | 32.1 /100 | #189 | Fair 9.2% |
| Arabs | 31.5 /100 | #190 | Fair 9.2% |
| Ugandans | 28.7 /100 | #191 | Fair 9.3% |
| Spanish | 28.7 /100 | #192 | Fair 9.3% |
| Immigrants | Western Asia | 28.2 /100 | #193 | Fair 9.3% |
| South Americans | 28.1 /100 | #194 | Fair 9.3% |
| Venezuelans | 27.4 /100 | #195 | Fair 9.3% |
| Immigrants | Venezuela | 26.1 /100 | #196 | Fair 9.3% |
| Immigrants | Colombia | 24.4 /100 | #197 | Fair 9.3% |
| Iraqis | 24.2 /100 | #198 | Fair 9.3% |
| Spaniards | 22.8 /100 | #199 | Fair 9.4% |
Demographics Similar to Immigrants from Pakistan by Family Poverty
In terms of family poverty, the demographic groups most similar to Immigrants from Pakistan are Immigrants from Philippines (8.0%, a difference of 0.010%), Immigrants from Turkey (8.0%, a difference of 0.030%), Tlingit-Haida (8.0%, a difference of 0.11%), Czechoslovakian (8.0%, a difference of 0.29%), and Immigrants from Switzerland (8.1%, a difference of 0.44%).
| Demographics | Rating | Rank | Family Poverty |
| Belgians | 97.3 /100 | #87 | Exceptional 8.0% |
| Serbians | 97.2 /100 | #88 | Exceptional 8.0% |
| Immigrants | Denmark | 97.1 /100 | #89 | Exceptional 8.0% |
| Immigrants | England | 97.1 /100 | #90 | Exceptional 8.0% |
| Immigrants | Italy | 97.0 /100 | #91 | Exceptional 8.0% |
| Czechoslovakians | 96.8 /100 | #92 | Exceptional 8.0% |
| Tlingit-Haida | 96.7 /100 | #93 | Exceptional 8.0% |
| Immigrants | Pakistan | 96.6 /100 | #94 | Exceptional 8.0% |
| Immigrants | Philippines | 96.5 /100 | #95 | Exceptional 8.0% |
| Immigrants | Turkey | 96.5 /100 | #96 | Exceptional 8.0% |
| Immigrants | Switzerland | 96.1 /100 | #97 | Exceptional 8.1% |
| Immigrants | South Africa | 95.9 /100 | #98 | Exceptional 8.1% |
| Welsh | 95.8 /100 | #99 | Exceptional 8.1% |
| New Zealanders | 95.8 /100 | #100 | Exceptional 8.1% |
| Immigrants | Norway | 95.7 /100 | #101 | Exceptional 8.1% |