Tongan vs Immigrants from Pakistan Family Poverty
COMPARE
Tongan
Immigrants from Pakistan
Family Poverty
Family Poverty Comparison
Tongans
Immigrants from Pakistan
7.7%
FAMILY POVERTY
98.9/ 100
METRIC RATING
46th/ 347
METRIC RANK
8.0%
FAMILY POVERTY
96.6/ 100
METRIC RATING
94th/ 347
METRIC RANK
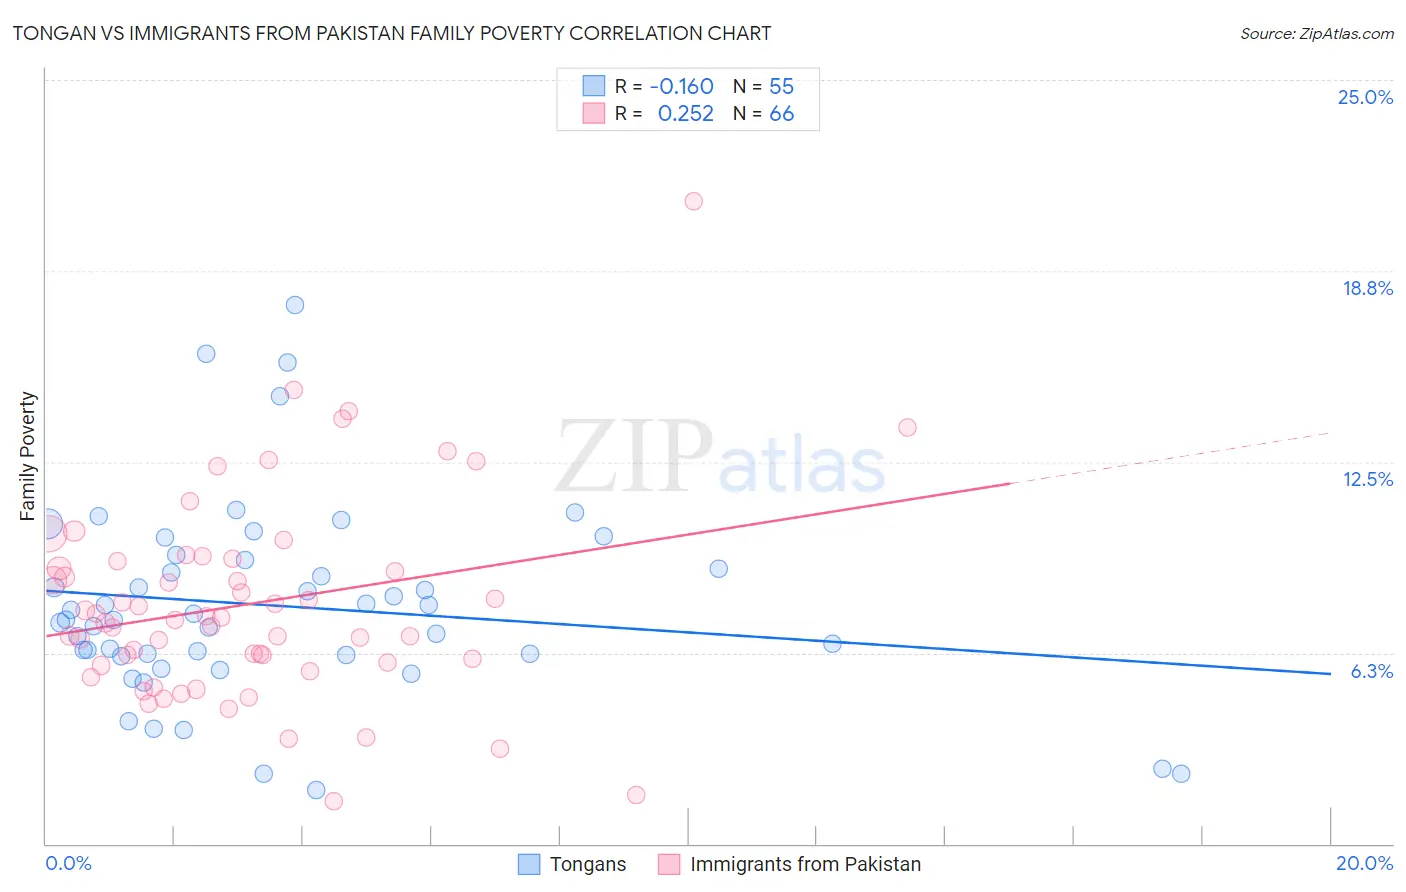
Tongan vs Immigrants from Pakistan Family Poverty Correlation Chart
The statistical analysis conducted on geographies consisting of 102,821,565 people shows a poor negative correlation between the proportion of Tongans and poverty level among families in the United States with a correlation coefficient (R) of -0.160 and weighted average of 7.7%. Similarly, the statistical analysis conducted on geographies consisting of 283,475,243 people shows a weak positive correlation between the proportion of Immigrants from Pakistan and poverty level among families in the United States with a correlation coefficient (R) of 0.252 and weighted average of 8.0%, a difference of 4.6%.
Family Poverty Correlation Summary
| Measurement | Tongan | Immigrants from Pakistan |
| Minimum | 1.8% | 1.4% |
| Maximum | 17.6% | 21.0% |
| Range | 15.9% | 19.6% |
| Mean | 7.8% | 7.8% |
| Median | 7.3% | 7.4% |
| Interquartile 25% (IQ1) | 6.2% | 5.9% |
| Interquartile 75% (IQ3) | 9.3% | 9.2% |
| Interquartile Range (IQR) | 3.1% | 3.3% |
| Standard Deviation (Sample) | 3.2% | 3.3% |
| Standard Deviation (Population) | 3.2% | 3.3% |
Similar Demographics by Family Poverty
Demographics Similar to Tongans by Family Poverty
In terms of family poverty, the demographic groups most similar to Tongans are Okinawan (7.7%, a difference of 0.010%), Immigrants from Czechoslovakia (7.7%, a difference of 0.010%), Immigrants from Sri Lanka (7.7%, a difference of 0.030%), German (7.7%, a difference of 0.14%), and Immigrants from Bolivia (7.7%, a difference of 0.22%).
| Demographics | Rating | Rank | Family Poverty |
| Carpatho Rusyns | 99.3 /100 | #39 | Exceptional 7.5% |
| Slovenes | 99.3 /100 | #40 | Exceptional 7.5% |
| Immigrants | Australia | 99.2 /100 | #41 | Exceptional 7.6% |
| Scandinavians | 99.1 /100 | #42 | Exceptional 7.6% |
| Immigrants | Austria | 99.1 /100 | #43 | Exceptional 7.6% |
| Germans | 99.0 /100 | #44 | Exceptional 7.7% |
| Okinawans | 98.9 /100 | #45 | Exceptional 7.7% |
| Tongans | 98.9 /100 | #46 | Exceptional 7.7% |
| Immigrants | Czechoslovakia | 98.9 /100 | #47 | Exceptional 7.7% |
| Immigrants | Sri Lanka | 98.9 /100 | #48 | Exceptional 7.7% |
| Immigrants | Bolivia | 98.9 /100 | #49 | Exceptional 7.7% |
| Immigrants | North Macedonia | 98.9 /100 | #50 | Exceptional 7.7% |
| Immigrants | Moldova | 98.8 /100 | #51 | Exceptional 7.7% |
| Indians (Asian) | 98.8 /100 | #52 | Exceptional 7.7% |
| Swiss | 98.8 /100 | #53 | Exceptional 7.7% |
Demographics Similar to Immigrants from Pakistan by Family Poverty
In terms of family poverty, the demographic groups most similar to Immigrants from Pakistan are Immigrants from Philippines (8.0%, a difference of 0.010%), Immigrants from Turkey (8.0%, a difference of 0.030%), Tlingit-Haida (8.0%, a difference of 0.11%), Czechoslovakian (8.0%, a difference of 0.29%), and Immigrants from Switzerland (8.1%, a difference of 0.44%).
| Demographics | Rating | Rank | Family Poverty |
| Belgians | 97.3 /100 | #87 | Exceptional 8.0% |
| Serbians | 97.2 /100 | #88 | Exceptional 8.0% |
| Immigrants | Denmark | 97.1 /100 | #89 | Exceptional 8.0% |
| Immigrants | England | 97.1 /100 | #90 | Exceptional 8.0% |
| Immigrants | Italy | 97.0 /100 | #91 | Exceptional 8.0% |
| Czechoslovakians | 96.8 /100 | #92 | Exceptional 8.0% |
| Tlingit-Haida | 96.7 /100 | #93 | Exceptional 8.0% |
| Immigrants | Pakistan | 96.6 /100 | #94 | Exceptional 8.0% |
| Immigrants | Philippines | 96.5 /100 | #95 | Exceptional 8.0% |
| Immigrants | Turkey | 96.5 /100 | #96 | Exceptional 8.0% |
| Immigrants | Switzerland | 96.1 /100 | #97 | Exceptional 8.1% |
| Immigrants | South Africa | 95.9 /100 | #98 | Exceptional 8.1% |
| Welsh | 95.8 /100 | #99 | Exceptional 8.1% |
| New Zealanders | 95.8 /100 | #100 | Exceptional 8.1% |
| Immigrants | Norway | 95.7 /100 | #101 | Exceptional 8.1% |