Cheyenne vs Immigrants from Netherlands Family Poverty
COMPARE
Cheyenne
Immigrants from Netherlands
Family Poverty
Family Poverty Comparison
Cheyenne
Immigrants from Netherlands
14.3%
FAMILY POVERTY
0.0/ 100
METRIC RATING
331st/ 347
METRIC RANK
7.7%
FAMILY POVERTY
98.6/ 100
METRIC RATING
61st/ 347
METRIC RANK
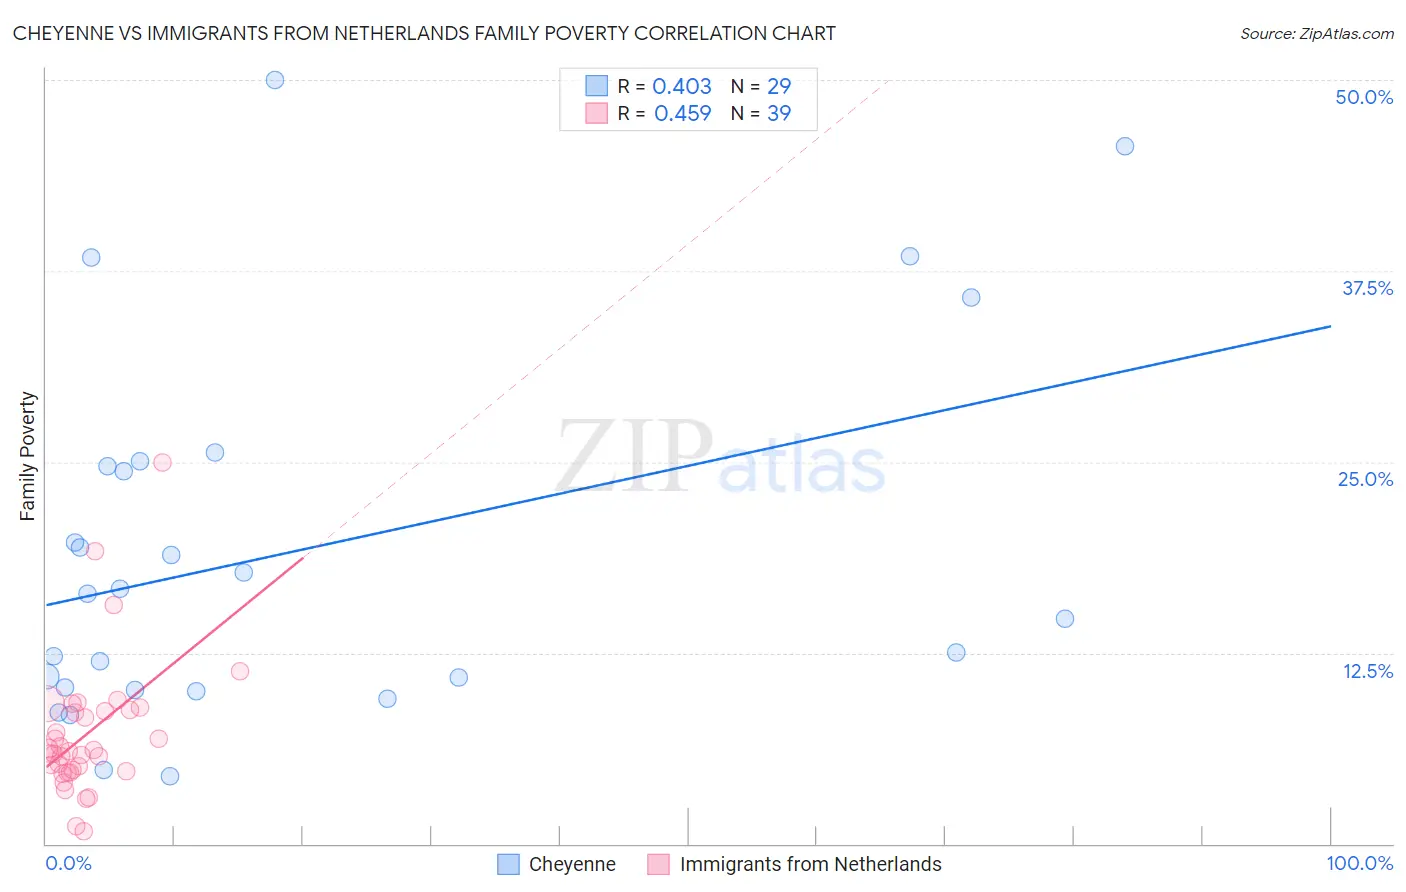
Cheyenne vs Immigrants from Netherlands Family Poverty Correlation Chart
The statistical analysis conducted on geographies consisting of 80,652,371 people shows a moderate positive correlation between the proportion of Cheyenne and poverty level among families in the United States with a correlation coefficient (R) of 0.403 and weighted average of 14.3%. Similarly, the statistical analysis conducted on geographies consisting of 237,430,105 people shows a moderate positive correlation between the proportion of Immigrants from Netherlands and poverty level among families in the United States with a correlation coefficient (R) of 0.459 and weighted average of 7.7%, a difference of 84.4%.
Family Poverty Correlation Summary
| Measurement | Cheyenne | Immigrants from Netherlands |
| Minimum | 4.4% | 0.78% |
| Maximum | 50.0% | 25.0% |
| Range | 45.6% | 24.2% |
| Mean | 19.2% | 7.2% |
| Median | 16.4% | 6.1% |
| Interquartile 25% (IQ1) | 10.1% | 4.7% |
| Interquartile 75% (IQ3) | 24.9% | 8.7% |
| Interquartile Range (IQR) | 14.7% | 4.0% |
| Standard Deviation (Sample) | 12.1% | 4.5% |
| Standard Deviation (Population) | 11.9% | 4.4% |
Similar Demographics by Family Poverty
Demographics Similar to Cheyenne by Family Poverty
In terms of family poverty, the demographic groups most similar to Cheyenne are Native/Alaskan (14.3%, a difference of 0.14%), Dominican (14.3%, a difference of 0.44%), Immigrants from Dominican Republic (14.4%, a difference of 1.1%), Houma (14.6%, a difference of 2.4%), and Apache (14.7%, a difference of 3.2%).
| Demographics | Rating | Rank | Family Poverty |
| Immigrants | Dominica | 0.0 /100 | #324 | Tragic 12.7% |
| Paiute | 0.0 /100 | #325 | Tragic 13.0% |
| Colville | 0.0 /100 | #326 | Tragic 13.0% |
| Yakama | 0.0 /100 | #327 | Tragic 13.1% |
| Central American Indians | 0.0 /100 | #328 | Tragic 13.3% |
| Blacks/African Americans | 0.0 /100 | #329 | Tragic 13.3% |
| Natives/Alaskans | 0.0 /100 | #330 | Tragic 14.3% |
| Cheyenne | 0.0 /100 | #331 | Tragic 14.3% |
| Dominicans | 0.0 /100 | #332 | Tragic 14.3% |
| Immigrants | Dominican Republic | 0.0 /100 | #333 | Tragic 14.4% |
| Houma | 0.0 /100 | #334 | Tragic 14.6% |
| Apache | 0.0 /100 | #335 | Tragic 14.7% |
| Sioux | 0.0 /100 | #336 | Tragic 15.9% |
| Hopi | 0.0 /100 | #337 | Tragic 15.9% |
| Crow | 0.0 /100 | #338 | Tragic 16.1% |
Demographics Similar to Immigrants from Netherlands by Family Poverty
In terms of family poverty, the demographic groups most similar to Immigrants from Netherlands are Immigrants from Greece (7.7%, a difference of 0.18%), European (7.7%, a difference of 0.19%), Macedonian (7.8%, a difference of 0.19%), Finnish (7.7%, a difference of 0.20%), and Asian (7.7%, a difference of 0.23%).
| Demographics | Rating | Rank | Family Poverty |
| Immigrants | Sweden | 98.8 /100 | #54 | Exceptional 7.7% |
| Immigrants | Eastern Asia | 98.7 /100 | #55 | Exceptional 7.7% |
| Immigrants | Serbia | 98.7 /100 | #56 | Exceptional 7.7% |
| Asians | 98.7 /100 | #57 | Exceptional 7.7% |
| Finns | 98.7 /100 | #58 | Exceptional 7.7% |
| Europeans | 98.7 /100 | #59 | Exceptional 7.7% |
| Immigrants | Greece | 98.7 /100 | #60 | Exceptional 7.7% |
| Immigrants | Netherlands | 98.6 /100 | #61 | Exceptional 7.7% |
| Macedonians | 98.6 /100 | #62 | Exceptional 7.8% |
| Zimbabweans | 98.4 /100 | #63 | Exceptional 7.8% |
| Koreans | 98.3 /100 | #64 | Exceptional 7.8% |
| Immigrants | Bulgaria | 98.3 /100 | #65 | Exceptional 7.8% |
| Dutch | 98.3 /100 | #66 | Exceptional 7.8% |
| Northern Europeans | 98.3 /100 | #67 | Exceptional 7.8% |
| Australians | 98.2 /100 | #68 | Exceptional 7.8% |