British West Indian vs Cypriot Single Male Poverty
COMPARE
British West Indian
Cypriot
Single Male Poverty
Single Male Poverty Comparison
British West Indians
Cypriots
13.4%
SINGLE MALE POVERTY
3.4/ 100
METRIC RATING
237th/ 347
METRIC RANK
11.7%
SINGLE MALE POVERTY
99.9/ 100
METRIC RATING
55th/ 347
METRIC RANK
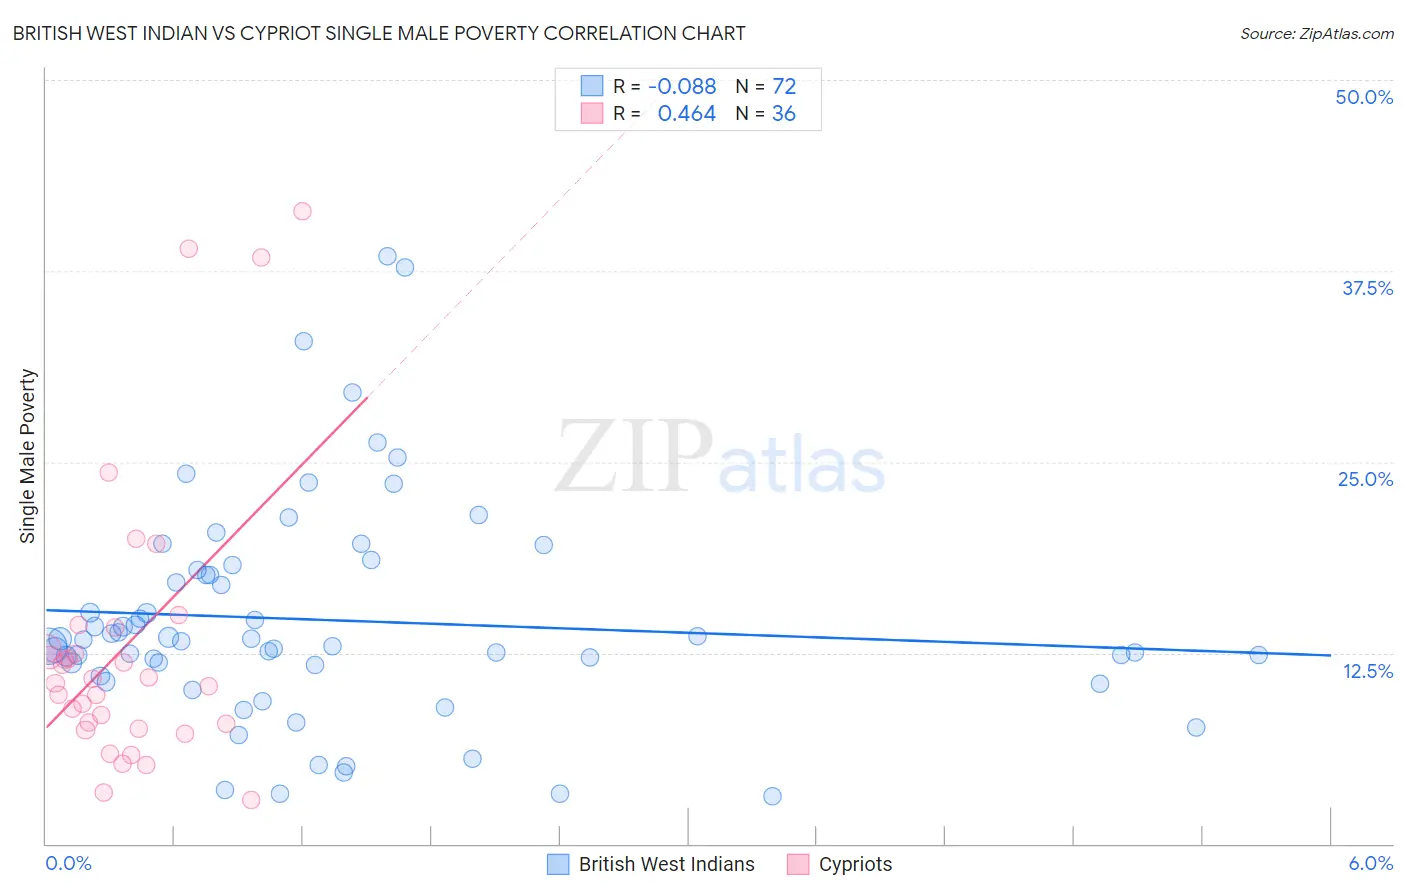
British West Indian vs Cypriot Single Male Poverty Correlation Chart
The statistical analysis conducted on geographies consisting of 145,852,012 people shows a slight negative correlation between the proportion of British West Indians and poverty level among single males in the United States with a correlation coefficient (R) of -0.088 and weighted average of 13.4%. Similarly, the statistical analysis conducted on geographies consisting of 58,678,740 people shows a moderate positive correlation between the proportion of Cypriots and poverty level among single males in the United States with a correlation coefficient (R) of 0.464 and weighted average of 11.7%, a difference of 14.3%.
Single Male Poverty Correlation Summary
| Measurement | British West Indian | Cypriot |
| Minimum | 3.1% | 2.9% |
| Maximum | 38.5% | 41.4% |
| Range | 35.3% | 38.5% |
| Mean | 14.6% | 12.9% |
| Median | 13.3% | 10.7% |
| Interquartile 25% (IQ1) | 11.3% | 7.7% |
| Interquartile 75% (IQ3) | 17.8% | 13.5% |
| Interquartile Range (IQR) | 6.4% | 5.8% |
| Standard Deviation (Sample) | 7.2% | 9.3% |
| Standard Deviation (Population) | 7.2% | 9.2% |
Similar Demographics by Single Male Poverty
Demographics Similar to British West Indians by Single Male Poverty
In terms of single male poverty, the demographic groups most similar to British West Indians are Luxembourger (13.4%, a difference of 0.060%), Immigrants from Ghana (13.4%, a difference of 0.10%), Bangladeshi (13.3%, a difference of 0.11%), Czechoslovakian (13.4%, a difference of 0.18%), and British (13.3%, a difference of 0.21%).
| Demographics | Rating | Rank | Single Male Poverty |
| Ghanaians | 6.1 /100 | #230 | Tragic 13.3% |
| Slavs | 5.3 /100 | #231 | Tragic 13.3% |
| Immigrants | Caribbean | 5.0 /100 | #232 | Tragic 13.3% |
| British | 4.0 /100 | #233 | Tragic 13.3% |
| Canadians | 4.0 /100 | #234 | Tragic 13.3% |
| Bangladeshis | 3.7 /100 | #235 | Tragic 13.3% |
| Luxembourgers | 3.6 /100 | #236 | Tragic 13.4% |
| British West Indians | 3.4 /100 | #237 | Tragic 13.4% |
| Immigrants | Ghana | 3.2 /100 | #238 | Tragic 13.4% |
| Czechoslovakians | 3.0 /100 | #239 | Tragic 13.4% |
| Belizeans | 2.3 /100 | #240 | Tragic 13.4% |
| Immigrants | Germany | 2.1 /100 | #241 | Tragic 13.4% |
| Carpatho Rusyns | 2.1 /100 | #242 | Tragic 13.4% |
| Barbadians | 2.1 /100 | #243 | Tragic 13.4% |
| Immigrants | Senegal | 1.7 /100 | #244 | Tragic 13.5% |
Demographics Similar to Cypriots by Single Male Poverty
In terms of single male poverty, the demographic groups most similar to Cypriots are Immigrants from Uzbekistan (11.7%, a difference of 0.17%), Bulgarian (11.7%, a difference of 0.19%), Samoan (11.7%, a difference of 0.29%), Burmese (11.7%, a difference of 0.31%), and Immigrants from Romania (11.7%, a difference of 0.46%).
| Demographics | Rating | Rank | Single Male Poverty |
| Immigrants | Indonesia | 99.9 /100 | #48 | Exceptional 11.6% |
| Tlingit-Haida | 99.9 /100 | #49 | Exceptional 11.6% |
| Immigrants | Lithuania | 99.9 /100 | #50 | Exceptional 11.6% |
| Paraguayans | 99.9 /100 | #51 | Exceptional 11.6% |
| Samoans | 99.9 /100 | #52 | Exceptional 11.7% |
| Bulgarians | 99.9 /100 | #53 | Exceptional 11.7% |
| Immigrants | Uzbekistan | 99.9 /100 | #54 | Exceptional 11.7% |
| Cypriots | 99.9 /100 | #55 | Exceptional 11.7% |
| Burmese | 99.8 /100 | #56 | Exceptional 11.7% |
| Immigrants | Romania | 99.8 /100 | #57 | Exceptional 11.7% |
| Immigrants | Brazil | 99.8 /100 | #58 | Exceptional 11.7% |
| Brazilians | 99.8 /100 | #59 | Exceptional 11.8% |
| Peruvians | 99.8 /100 | #60 | Exceptional 11.8% |
| Cambodians | 99.8 /100 | #61 | Exceptional 11.8% |
| Immigrants | Sri Lanka | 99.7 /100 | #62 | Exceptional 11.8% |