Cherokee vs Blackfeet Householder Income Under 25 years
COMPARE
Cherokee
Blackfeet
Householder Income Under 25 years
Householder Income Under 25 years Comparison
Cherokee
Blackfeet
$47,848
HOUSEHOLDER INCOME UNDER 25 YEARS
0.0/ 100
METRIC RATING
305th/ 347
METRIC RANK
$48,603
HOUSEHOLDER INCOME UNDER 25 YEARS
0.0/ 100
METRIC RATING
296th/ 347
METRIC RANK
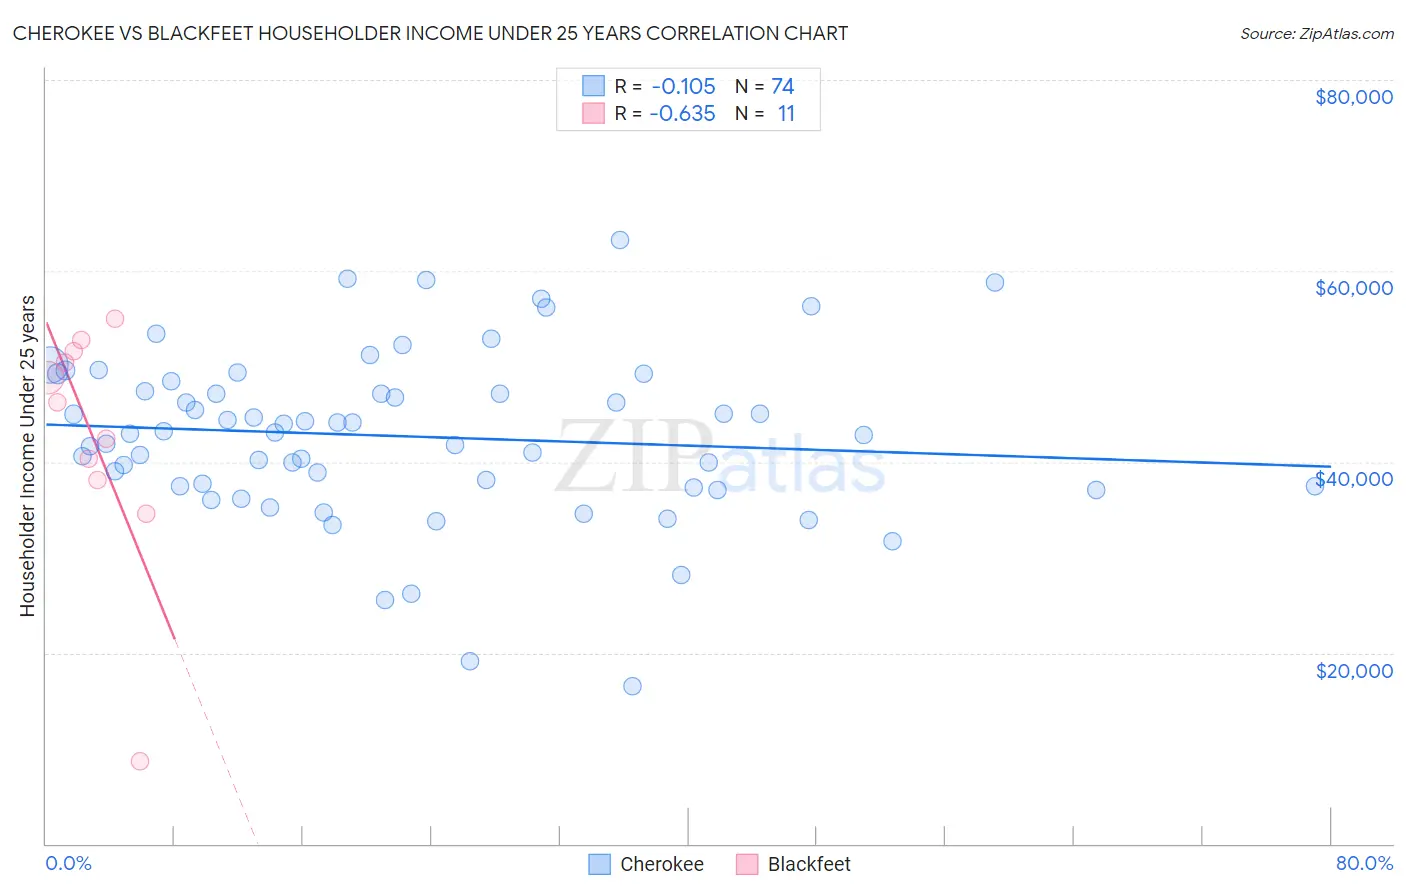
Cherokee vs Blackfeet Householder Income Under 25 years Correlation Chart
The statistical analysis conducted on geographies consisting of 404,177,711 people shows a poor negative correlation between the proportion of Cherokee and household income with householder under the age of 25 in the United States with a correlation coefficient (R) of -0.105 and weighted average of $47,848. Similarly, the statistical analysis conducted on geographies consisting of 272,591,865 people shows a significant negative correlation between the proportion of Blackfeet and household income with householder under the age of 25 in the United States with a correlation coefficient (R) of -0.635 and weighted average of $48,603, a difference of 1.6%.
Householder Income Under 25 years Correlation Summary
| Measurement | Cherokee | Blackfeet |
| Minimum | $16,563 | $8,611 |
| Maximum | $63,295 | $55,000 |
| Range | $46,732 | $46,389 |
| Mean | $42,680 | $42,623 |
| Median | $43,010 | $46,273 |
| Interquartile 25% (IQ1) | $37,476 | $38,076 |
| Interquartile 75% (IQ3) | $47,453 | $51,620 |
| Interquartile Range (IQR) | $9,977 | $13,544 |
| Standard Deviation (Sample) | $8,797 | $13,025 |
| Standard Deviation (Population) | $8,737 | $12,419 |
Demographics Similar to Cherokee and Blackfeet by Householder Income Under 25 years
In terms of householder income under 25 years, the demographic groups most similar to Cherokee are Menominee ($47,907, a difference of 0.12%), Immigrants from Middle Africa ($47,916, a difference of 0.14%), Immigrants from Liberia ($47,981, a difference of 0.28%), Native/Alaskan ($47,704, a difference of 0.30%), and Bangladeshi ($47,589, a difference of 0.55%). Similarly, the demographic groups most similar to Blackfeet are Central American Indian ($48,643, a difference of 0.080%), Somali ($48,657, a difference of 0.11%), Subsaharan African ($48,691, a difference of 0.18%), Cree ($48,514, a difference of 0.18%), and Shoshone ($48,720, a difference of 0.24%).
| Demographics | Rating | Rank | Householder Income Under 25 years |
| Americans | 0.0 /100 | #290 | Tragic $48,860 |
| Immigrants | Burma/Myanmar | 0.0 /100 | #291 | Tragic $48,749 |
| Shoshone | 0.0 /100 | #292 | Tragic $48,720 |
| Sub-Saharan Africans | 0.0 /100 | #293 | Tragic $48,691 |
| Somalis | 0.0 /100 | #294 | Tragic $48,657 |
| Central American Indians | 0.0 /100 | #295 | Tragic $48,643 |
| Blackfeet | 0.0 /100 | #296 | Tragic $48,603 |
| Cree | 0.0 /100 | #297 | Tragic $48,514 |
| Yaqui | 0.0 /100 | #298 | Tragic $48,300 |
| Immigrants | Honduras | 0.0 /100 | #299 | Tragic $48,267 |
| Immigrants | Somalia | 0.0 /100 | #300 | Tragic $48,135 |
| Immigrants | Kuwait | 0.0 /100 | #301 | Tragic $48,126 |
| Immigrants | Liberia | 0.0 /100 | #302 | Tragic $47,981 |
| Immigrants | Middle Africa | 0.0 /100 | #303 | Tragic $47,916 |
| Menominee | 0.0 /100 | #304 | Tragic $47,907 |
| Cherokee | 0.0 /100 | #305 | Tragic $47,848 |
| Natives/Alaskans | 0.0 /100 | #306 | Tragic $47,704 |
| Bangladeshis | 0.0 /100 | #307 | Tragic $47,589 |
| Comanche | 0.0 /100 | #308 | Tragic $47,518 |
| U.S. Virgin Islanders | 0.0 /100 | #309 | Tragic $47,448 |
| Iroquois | 0.0 /100 | #310 | Tragic $47,380 |