Cherokee vs Pennsylvania German Single Mother Poverty
COMPARE
Cherokee
Pennsylvania German
Single Mother Poverty
Single Mother Poverty Comparison
Cherokee
Pennsylvania Germans
34.5%
SINGLE MOTHER POVERTY
0.0/ 100
METRIC RATING
317th/ 347
METRIC RANK
33.2%
SINGLE MOTHER POVERTY
0.0/ 100
METRIC RATING
297th/ 347
METRIC RANK
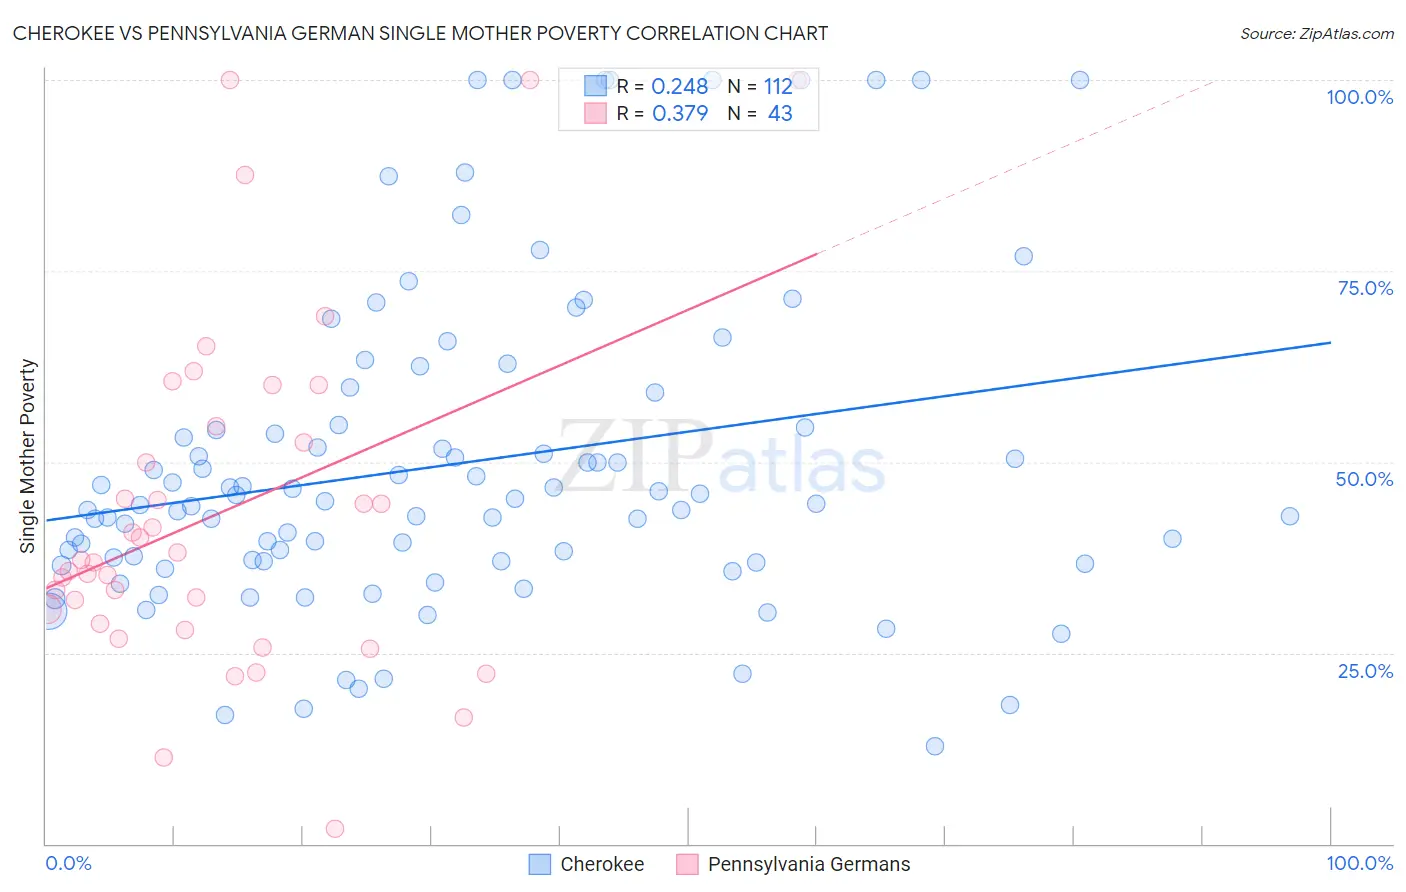
Cherokee vs Pennsylvania German Single Mother Poverty Correlation Chart
The statistical analysis conducted on geographies consisting of 479,873,905 people shows a weak positive correlation between the proportion of Cherokee and poverty level among single mothers in the United States with a correlation coefficient (R) of 0.248 and weighted average of 34.5%. Similarly, the statistical analysis conducted on geographies consisting of 229,321,350 people shows a mild positive correlation between the proportion of Pennsylvania Germans and poverty level among single mothers in the United States with a correlation coefficient (R) of 0.379 and weighted average of 33.2%, a difference of 3.9%.
Single Mother Poverty Correlation Summary
| Measurement | Cherokee | Pennsylvania German |
| Minimum | 12.7% | 1.9% |
| Maximum | 100.0% | 100.0% |
| Range | 87.3% | 98.1% |
| Mean | 49.7% | 43.4% |
| Median | 44.6% | 37.2% |
| Interquartile 25% (IQ1) | 37.0% | 28.9% |
| Interquartile 75% (IQ3) | 54.7% | 54.6% |
| Interquartile Range (IQR) | 17.6% | 25.7% |
| Standard Deviation (Sample) | 20.8% | 22.5% |
| Standard Deviation (Population) | 20.7% | 22.3% |
Demographics Similar to Cherokee and Pennsylvania Germans by Single Mother Poverty
In terms of single mother poverty, the demographic groups most similar to Cherokee are Dominican (34.5%, a difference of 0.11%), Hopi (34.5%, a difference of 0.22%), Chickasaw (34.4%, a difference of 0.30%), Immigrants from Dominican Republic (34.4%, a difference of 0.48%), and Central American Indian (34.3%, a difference of 0.56%). Similarly, the demographic groups most similar to Pennsylvania Germans are African (33.3%, a difference of 0.11%), Immigrants from Guatemala (33.3%, a difference of 0.20%), Hispanic or Latino (33.3%, a difference of 0.20%), Immigrants from Somalia (33.4%, a difference of 0.44%), and Arapaho (33.4%, a difference of 0.59%).
| Demographics | Rating | Rank | Single Mother Poverty |
| Pennsylvania Germans | 0.0 /100 | #297 | Tragic 33.2% |
| Africans | 0.0 /100 | #298 | Tragic 33.3% |
| Immigrants | Guatemala | 0.0 /100 | #299 | Tragic 33.3% |
| Hispanics or Latinos | 0.0 /100 | #300 | Tragic 33.3% |
| Immigrants | Somalia | 0.0 /100 | #301 | Tragic 33.4% |
| Arapaho | 0.0 /100 | #302 | Tragic 33.4% |
| Americans | 0.0 /100 | #303 | Tragic 33.5% |
| Mexicans | 0.0 /100 | #304 | Tragic 33.6% |
| Immigrants | Central America | 0.0 /100 | #305 | Tragic 33.6% |
| Immigrants | Congo | 0.0 /100 | #306 | Tragic 33.8% |
| Comanche | 0.0 /100 | #307 | Tragic 33.9% |
| Immigrants | Mexico | 0.0 /100 | #308 | Tragic 34.0% |
| Potawatomi | 0.0 /100 | #309 | Tragic 34.1% |
| Hondurans | 0.0 /100 | #310 | Tragic 34.2% |
| Alsatians | 0.0 /100 | #311 | Tragic 34.3% |
| Central American Indians | 0.0 /100 | #312 | Tragic 34.3% |
| Immigrants | Dominican Republic | 0.0 /100 | #313 | Tragic 34.4% |
| Chickasaw | 0.0 /100 | #314 | Tragic 34.4% |
| Hopi | 0.0 /100 | #315 | Tragic 34.5% |
| Dominicans | 0.0 /100 | #316 | Tragic 34.5% |
| Cherokee | 0.0 /100 | #317 | Tragic 34.5% |