Cherokee vs Serbian Single Mother Poverty

COMPARE

Cherokee
Race
Ancestry
AfghanAfricanAlaska NativeAlaskan AthabascanAlbanianAleutAlsatianAmericanApacheArabArapahoArgentineanArmenianAssyrian/Chaldean/SyriacAustralianAustrianBahamianBangladeshiBarbadianBasqueBelgianBelizeanBermudanBhutaneseBlackfeetBolivianBrazilianBritishBritish West IndianBulgarianBurmeseCajunCambodianCanadianCape VerdeanCarpatho RusynCelticCentral AmericanCentral American IndianCherokeeCheyenneChickasawChileanChineseChippewaChoctawColombianColvilleComancheCosta RicanCreeCreekCroatianCrowCubanCypriotCzechCzechoslovakianDanishDelawareDominicanDutchDutch West IndianEastern EuropeanEcuadorianEgyptianEnglishEstonianEthiopianEuropeanFijianFilipinoFinnishFrenchFrench American IndianFrench CanadianGermanGerman RussianGhanaianGreekGuamanian/ChamorroGuatemalanGuyaneseHaitianHmongHonduranHopiHoumaHungarianIcelanderIndian (Asian)IndonesianInupiatIranianIraqiIrishIroquoisIsraeliItalianJamaicanJapaneseJordanianKenyanKiowaKoreanLaotianLatvianLebaneseLiberianLithuanianLumbeeLuxembourgerMacedonianMalaysianMalteseMarshalleseMenomineeMexicanMexican American IndianMongolianMoroccanNative HawaiianNavajoNepaleseNew ZealanderNicaraguanNigerianNorthern EuropeanNorwegianOkinawanOsageOttawaPaiutePakistaniPalestinianPanamanianParaguayanPennsylvania GermanPeruvianPimaPolishPortuguesePotawatomiPuebloPuerto RicanPuget Sound SalishRomanianRussianSalvadoranSamoanScandinavianScotch-IrishScottishSeminoleSenegaleseShoshoneSierra LeoneanSiouxSlavicSlovakSloveneSomaliSouth AfricanSouth AmericanSouth American IndianSoviet UnionSpaniardSpanishSpanish AmericanSpanish American IndianSri LankanSubsaharan AfricanSudaneseSwedishSwissSyrianTaiwaneseThaiTlingit-HaidaTohono O'OdhamTonganTrinidadian and TobagonianTsimshianTurkishU.S. Virgin IslanderUgandanUkrainianUruguayanUteVenezuelanVietnameseWelshWest IndianYakamaYaquiYugoslavianYumanYup'ikZimbabwean
Immigration
NonimmigrantsImmigrantsAfghanistanAfricaAlbaniaArgentinaArmeniaAsiaAustraliaAustriaBahamasBangladeshBarbadosBelarusBelgiumBelizeBoliviaBosnia and HerzegovinaBrazilBulgariaBurma/MyanmarCabo VerdeCambodiaCameroonCanadaCaribbeanCentral AmericaChileChinaColombiaCongoCosta RicaCroatiaCubaCzechoslovakiaDenmarkDominicaDominican RepublicEastern AfricaEastern AsiaEastern EuropeEcuadorEgyptEl SalvadorEnglandEritreaEthiopiaEuropeFijiFranceGermanyGhanaGreeceGrenadaGuatemalaGuyanaHaitiHondurasHong KongHungaryIndiaIndonesiaIranIraqIrelandIsraelItalyJamaicaJapanJordanKazakhstanKenyaKoreaKuwaitLaosLatin AmericaLatviaLebanonLiberiaLithuaniaMalaysiaMexicoMicronesiaMiddle AfricaMoldovaMoroccoNepalNetherlandsNicaraguaNigeriaNorth AmericaNorth MacedoniaNorthern AfricaNorthern EuropeNorwayOceaniaPakistanPanamaPeruPhilippinesPolandPortugalRomaniaRussiaSaudi ArabiaScotlandSenegalSerbiaSierra LeoneSingaporeSomaliaSouth AfricaSouth AmericaSouth Central AsiaSouth Eastern AsiaSouthern EuropeSpainSri LankaSt. Vincent and the GrenadinesSudanSwedenSwitzerlandSyriaTaiwanThailandTrinidad and TobagoTurkeyUgandaUkraineUruguayUzbekistanVenezuelaVietnamWest IndiesWestern AfricaWestern AsiaWestern EuropeYemenZaireZimbabweAzores
Serbian
Race
Ancestry
AfghanAfricanAlaska NativeAlaskan AthabascanAlbanianAleutAlsatianAmericanApacheArabArapahoArgentineanArmenianAssyrian/Chaldean/SyriacAustralianAustrianBahamianBangladeshiBarbadianBasqueBelgianBelizeanBermudanBhutaneseBlackfeetBolivianBrazilianBritishBritish West IndianBulgarianBurmeseCajunCambodianCanadianCape VerdeanCarpatho RusynCelticCentral AmericanCentral American IndianCheyenneChickasawChileanChineseChippewaChoctawColombianColvilleComancheCosta RicanCreeCreekCroatianCrowCubanCypriotCzechCzechoslovakianDanishDelawareDominicanDutchDutch West IndianEastern EuropeanEcuadorianEgyptianEnglishEstonianEthiopianEuropeanFijianFilipinoFinnishFrenchFrench American IndianFrench CanadianGermanGerman RussianGhanaianGreekGuamanian/ChamorroGuatemalanGuyaneseHaitianHmongHonduranHopiHoumaHungarianIcelanderIndian (Asian)IndonesianInupiatIranianIraqiIrishIroquoisIsraeliItalianJamaicanJapaneseJordanianKenyanKiowaKoreanLaotianLatvianLebaneseLiberianLithuanianLumbeeLuxembourgerMacedonianMalaysianMalteseMarshalleseMenomineeMexicanMexican American IndianMongolianMoroccanNative HawaiianNavajoNepaleseNew ZealanderNicaraguanNigerianNorthern EuropeanNorwegianOkinawanOsageOttawaPaiutePakistaniPalestinianPanamanianParaguayanPennsylvania GermanPeruvianPimaPolishPortuguesePotawatomiPuebloPuerto RicanPuget Sound SalishRomanianRussianSalvadoranSamoanScandinavianScotch-IrishScottishSeminoleSenegaleseSerbianShoshoneSierra LeoneanSiouxSlavicSlovakSloveneSomaliSouth AfricanSouth AmericanSouth American IndianSoviet UnionSpaniardSpanishSpanish AmericanSpanish American IndianSri LankanSubsaharan AfricanSudaneseSwedishSwissSyrianTaiwaneseThaiTlingit-HaidaTohono O'OdhamTonganTrinidadian and TobagonianTsimshianTurkishU.S. Virgin IslanderUgandanUkrainianUruguayanUteVenezuelanVietnameseWelshWest IndianYakamaYaquiYugoslavianYumanYup'ikZimbabwean
Immigration
NonimmigrantsImmigrantsAfghanistanAfricaAlbaniaArgentinaArmeniaAsiaAustraliaAustriaBahamasBangladeshBarbadosBelarusBelgiumBelizeBoliviaBosnia and HerzegovinaBrazilBulgariaBurma/MyanmarCabo VerdeCambodiaCameroonCanadaCaribbeanCentral AmericaChileChinaColombiaCongoCosta RicaCroatiaCubaCzechoslovakiaDenmarkDominicaDominican RepublicEastern AfricaEastern AsiaEastern EuropeEcuadorEgyptEl SalvadorEnglandEritreaEthiopiaEuropeFijiFranceGermanyGhanaGreeceGrenadaGuatemalaGuyanaHaitiHondurasHong KongHungaryIndiaIndonesiaIranIraqIrelandIsraelItalyJamaicaJapanJordanKazakhstanKenyaKoreaKuwaitLaosLatin AmericaLatviaLebanonLiberiaLithuaniaMalaysiaMexicoMicronesiaMiddle AfricaMoldovaMoroccoNepalNetherlandsNicaraguaNigeriaNorth AmericaNorth MacedoniaNorthern AfricaNorthern EuropeNorwayOceaniaPakistanPanamaPeruPhilippinesPolandPortugalRomaniaRussiaSaudi ArabiaScotlandSenegalSerbiaSierra LeoneSingaporeSomaliaSouth AfricaSouth AmericaSouth Central AsiaSouth Eastern AsiaSouthern EuropeSpainSri LankaSt. Vincent and the GrenadinesSudanSwedenSwitzerlandSyriaTaiwanThailandTrinidad and TobagoTurkeyUgandaUkraineUruguayUzbekistanVenezuelaVietnamWest IndiesWestern AfricaWestern AsiaWestern EuropeYemenZaireZimbabweAzores
Single Mother Poverty
Income
Poverty
Unemployment
Labor Participation
Family Structure
Vehicle Availability
Education Level
Disability

Single Mother Poverty Comparison

Cherokee

Serbians

Tragic
Excellent
34.5%
SINGLE MOTHER POVERTY
0.0/ 100
METRIC RATING
317th/ 347
METRIC RANK
28.6%
SINGLE MOTHER POVERTY
85.0/ 100
METRIC RATING
149th/ 347
METRIC RANK

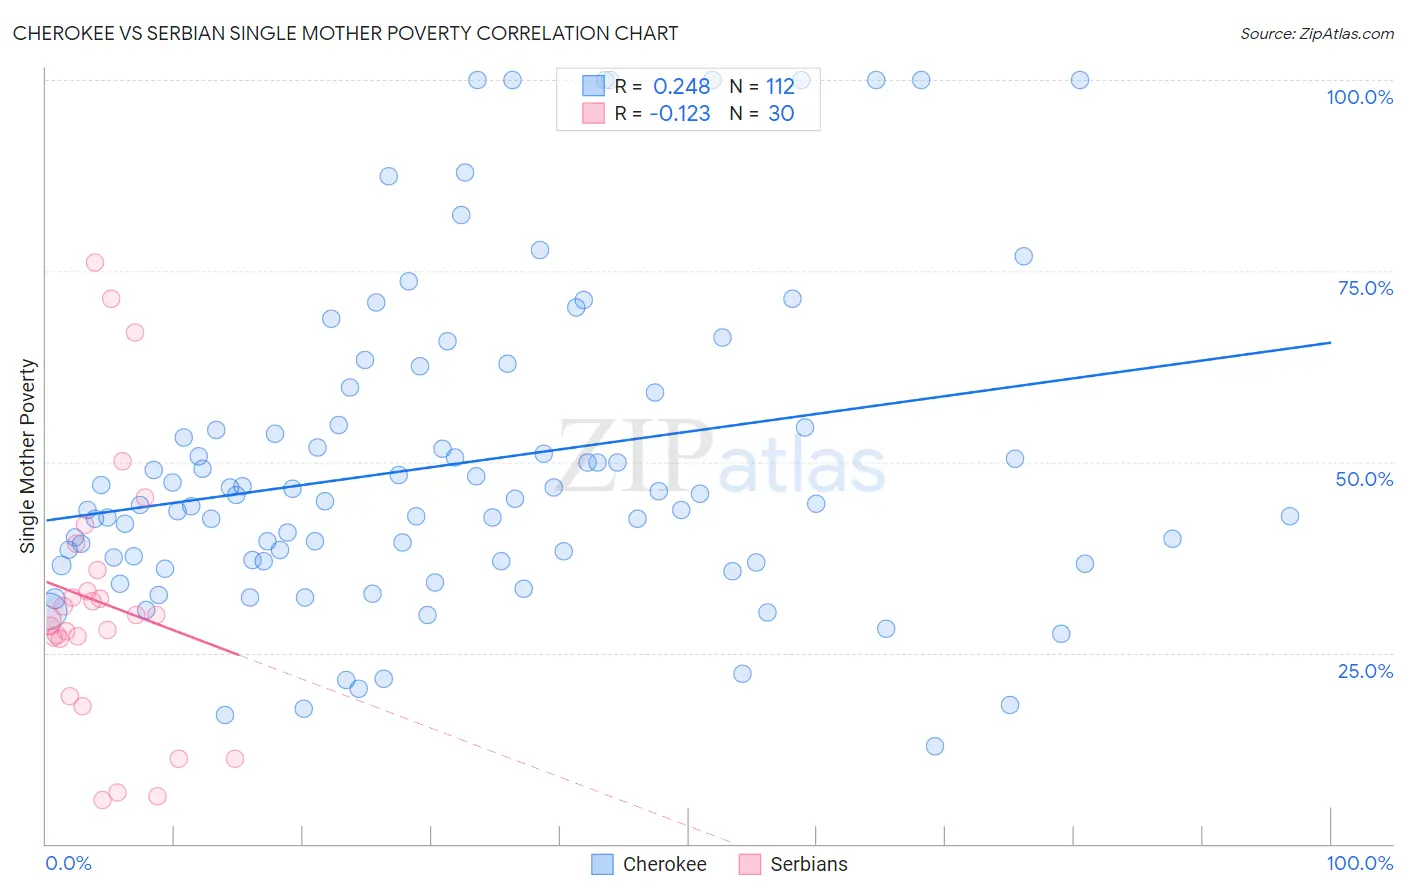
Cherokee vs Serbian Single Mother Poverty Correlation Chart

The statistical analysis conducted on geographies consisting of 479,873,905 people shows a weak positive correlation between the proportion of Cherokee and poverty level among single mothers in the United States with a correlation coefficient (R) of 0.248 and weighted average of 34.5%. Similarly, the statistical analysis conducted on geographies consisting of 262,198,183 people shows a poor negative correlation between the proportion of Serbians and poverty level among single mothers in the United States with a correlation coefficient (R) of -0.123 and weighted average of 28.6%, a difference of 20.9%.
Cherokee vs Serbian Single Mother Poverty

Single Mother Poverty Correlation Summary

MeasurementCherokeeSerbian
Minimum12.7%5.8%
Maximum100.0%76.1%
Range87.3%70.4%
Mean49.7%31.6%
Median44.6%29.6%
Interquartile 25% (IQ1)37.0%26.8%
Interquartile 75% (IQ3)54.7%35.8%
Interquartile Range (IQR)17.6%9.0%
Standard Deviation (Sample)20.8%17.4%
Standard Deviation (Population)20.7%17.1%

Similar Demographics by Single Mother Poverty

Demographics Similar to Cherokee by Single Mother Poverty

In terms of single mother poverty, the demographic groups most similar to Cherokee are Dominican (34.5%, a difference of 0.11%), Hopi (34.5%, a difference of 0.22%), Chickasaw (34.4%, a difference of 0.30%), Immigrants from Dominican Republic (34.4%, a difference of 0.48%), and Immigrants from Honduras (34.7%, a difference of 0.52%).
DemographicsRating | RankSingle Mother Poverty
Hondurans
0.0
/100
|
#310
Tragic
34.2%
Alsatians
0.0
/100
|
#311
Tragic
34.3%
Central American Indians
0.0
/100
|
#312
Tragic
34.3%
Immigrants | Dominican Republic
0.0
/100
|
#313
Tragic
34.4%
Chickasaw
0.0
/100
|
#314
Tragic
34.4%
Hopi
0.0
/100
|
#315
Tragic
34.5%
Dominicans
0.0
/100
|
#316
Tragic
34.5%
Cherokee
0.0
/100
|
#317
Tragic
34.5%
Immigrants | Honduras
0.0
/100
|
#318
Tragic
34.7%
Chippewa
0.0
/100
|
#319
Tragic
34.8%
Iroquois
0.0
/100
|
#320
Tragic
34.8%
Paiute
0.0
/100
|
#321
Tragic
35.1%
Blacks/African Americans
0.0
/100
|
#322
Tragic
35.2%
Kiowa
0.0
/100
|
#323
Tragic
35.5%
Ottawa
0.0
/100
|
#324
Tragic
35.5%

Demographics Similar to Serbians by Single Mother Poverty

In terms of single mother poverty, the demographic groups most similar to Serbians are Syrian (28.6%, a difference of 0.020%), Immigrants from Lebanon (28.6%, a difference of 0.030%), Immigrants from Denmark (28.5%, a difference of 0.10%), Immigrants from South America (28.5%, a difference of 0.11%), and Luxembourger (28.5%, a difference of 0.14%).
DemographicsRating | RankSingle Mother Poverty
South Africans
86.6
/100
|
#142
Excellent
28.5%
Immigrants | North America
86.5
/100
|
#143
Excellent
28.5%
Luxembourgers
86.4
/100
|
#144
Excellent
28.5%
Immigrants | South America
86.1
/100
|
#145
Excellent
28.5%
Immigrants | Denmark
86.1
/100
|
#146
Excellent
28.5%
Immigrants | Lebanon
85.3
/100
|
#147
Excellent
28.6%
Syrians
85.3
/100
|
#148
Excellent
28.6%
Serbians
85.0
/100
|
#149
Excellent
28.6%
Northern Europeans
81.7
/100
|
#150
Excellent
28.6%
Immigrants | Oceania
79.9
/100
|
#151
Good
28.7%
Austrians
79.0
/100
|
#152
Good
28.7%
Slovenes
76.4
/100
|
#153
Good
28.8%
Portuguese
73.2
/100
|
#154
Good
28.8%
Ugandans
71.7
/100
|
#155
Good
28.8%
Iraqis
71.5
/100
|
#156
Good
28.8%