Central American Indian vs Bahamian Single Father Poverty
COMPARE
Central American Indian
Bahamian
Single Father Poverty
Single Father Poverty Comparison
Central American Indians
Bahamians
21.7%
SINGLE FATHER POVERTY
0.0/ 100
METRIC RATING
331st/ 347
METRIC RANK
18.0%
SINGLE FATHER POVERTY
0.0/ 100
METRIC RATING
288th/ 347
METRIC RANK
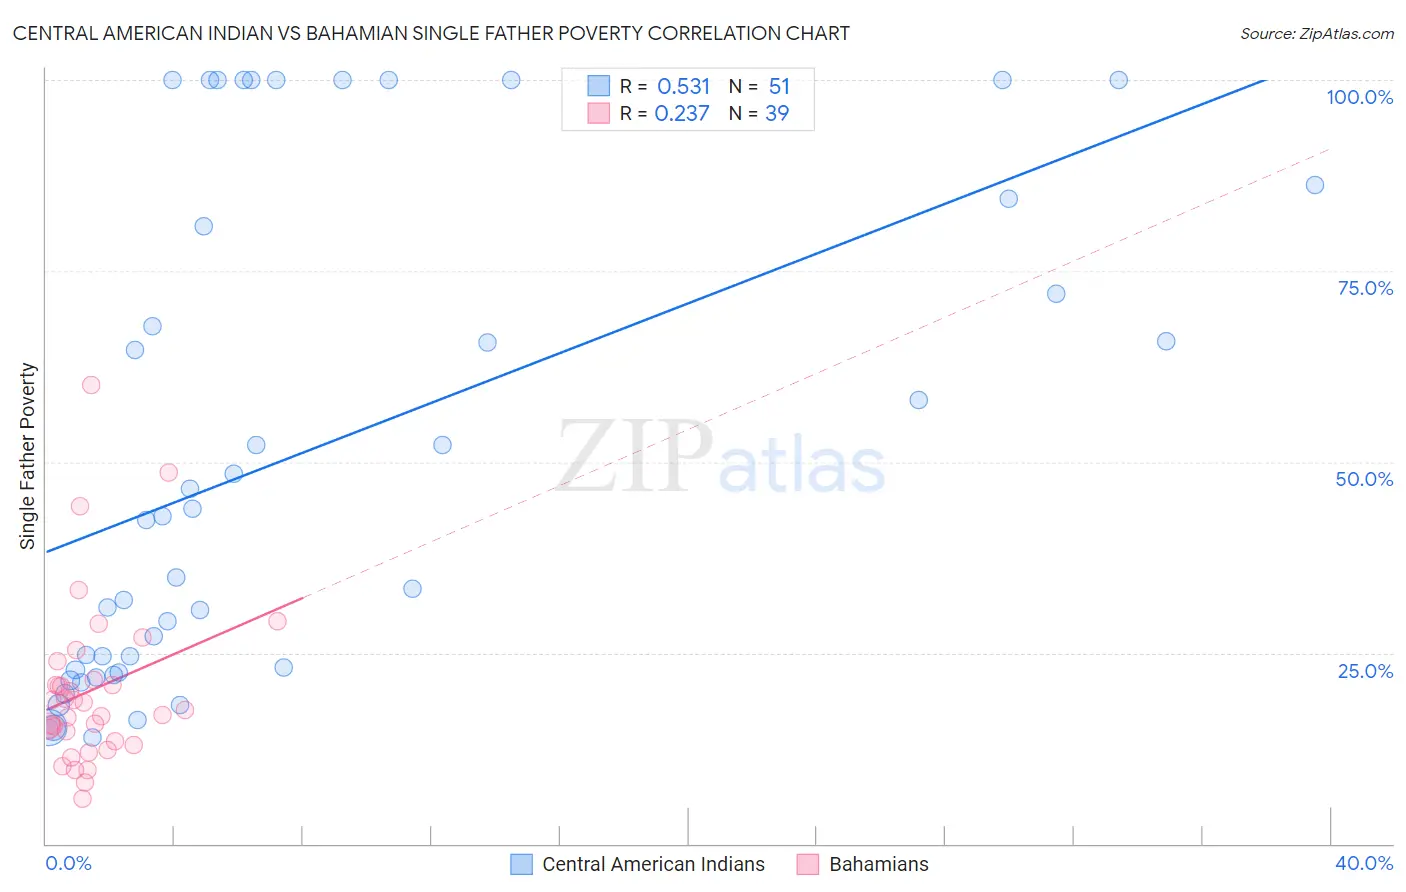
Central American Indian vs Bahamian Single Father Poverty Correlation Chart
The statistical analysis conducted on geographies consisting of 271,383,000 people shows a substantial positive correlation between the proportion of Central American Indians and poverty level among single fathers in the United States with a correlation coefficient (R) of 0.531 and weighted average of 21.7%. Similarly, the statistical analysis conducted on geographies consisting of 102,772,098 people shows a weak positive correlation between the proportion of Bahamians and poverty level among single fathers in the United States with a correlation coefficient (R) of 0.237 and weighted average of 18.0%, a difference of 20.7%.
Single Father Poverty Correlation Summary
| Measurement | Central American Indian | Bahamian |
| Minimum | 13.9% | 6.0% |
| Maximum | 100.0% | 60.0% |
| Range | 86.1% | 54.0% |
| Mean | 51.7% | 20.1% |
| Median | 42.9% | 17.6% |
| Interquartile 25% (IQ1) | 22.7% | 13.4% |
| Interquartile 75% (IQ3) | 84.4% | 21.5% |
| Interquartile Range (IQR) | 61.6% | 8.0% |
| Standard Deviation (Sample) | 31.7% | 10.9% |
| Standard Deviation (Population) | 31.4% | 10.8% |
Similar Demographics by Single Father Poverty
Demographics Similar to Central American Indians by Single Father Poverty
In terms of single father poverty, the demographic groups most similar to Central American Indians are Paiute (21.6%, a difference of 0.27%), Tohono O'odham (22.0%, a difference of 1.5%), Colville (21.4%, a difference of 1.5%), Pueblo (21.1%, a difference of 2.6%), and Native/Alaskan (22.4%, a difference of 3.3%).
| Demographics | Rating | Rank | Single Father Poverty |
| Americans | 0.0 /100 | #324 | Tragic 20.1% |
| Blacks/African Americans | 0.0 /100 | #325 | Tragic 20.4% |
| Immigrants | Yemen | 0.0 /100 | #326 | Tragic 20.6% |
| Choctaw | 0.0 /100 | #327 | Tragic 20.7% |
| Pueblo | 0.0 /100 | #328 | Tragic 21.1% |
| Colville | 0.0 /100 | #329 | Tragic 21.4% |
| Paiute | 0.0 /100 | #330 | Tragic 21.6% |
| Central American Indians | 0.0 /100 | #331 | Tragic 21.7% |
| Tohono O'odham | 0.0 /100 | #332 | Tragic 22.0% |
| Natives/Alaskans | 0.0 /100 | #333 | Tragic 22.4% |
| Kiowa | 0.0 /100 | #334 | Tragic 22.5% |
| Shoshone | 0.0 /100 | #335 | Tragic 22.9% |
| Cajuns | 0.0 /100 | #336 | Tragic 23.1% |
| Sioux | 0.0 /100 | #337 | Tragic 23.9% |
| Arapaho | 0.0 /100 | #338 | Tragic 24.0% |
Demographics Similar to Bahamians by Single Father Poverty
In terms of single father poverty, the demographic groups most similar to Bahamians are Carpatho Rusyn (18.0%, a difference of 0.020%), Immigrants from North Macedonia (17.9%, a difference of 0.25%), Immigrants from Lebanon (17.9%, a difference of 0.42%), Irish (18.0%, a difference of 0.44%), and West Indian (18.0%, a difference of 0.47%).
| Demographics | Rating | Rank | Single Father Poverty |
| English | 0.0 /100 | #281 | Tragic 17.8% |
| Dutch | 0.0 /100 | #282 | Tragic 17.8% |
| Alsatians | 0.0 /100 | #283 | Tragic 17.8% |
| Welsh | 0.0 /100 | #284 | Tragic 17.8% |
| Immigrants | Lebanon | 0.0 /100 | #285 | Tragic 17.9% |
| Immigrants | North Macedonia | 0.0 /100 | #286 | Tragic 17.9% |
| Carpatho Rusyns | 0.0 /100 | #287 | Tragic 18.0% |
| Bahamians | 0.0 /100 | #288 | Tragic 18.0% |
| Irish | 0.0 /100 | #289 | Tragic 18.0% |
| West Indians | 0.0 /100 | #290 | Tragic 18.0% |
| Alaskan Athabascans | 0.0 /100 | #291 | Tragic 18.1% |
| Immigrants | Bahamas | 0.0 /100 | #292 | Tragic 18.1% |
| Alaska Natives | 0.0 /100 | #293 | Tragic 18.1% |
| U.S. Virgin Islanders | 0.0 /100 | #294 | Tragic 18.1% |
| Yakama | 0.0 /100 | #295 | Tragic 18.1% |