Central American Indian vs Ethiopian Single Father Poverty
COMPARE
Central American Indian
Ethiopian
Single Father Poverty
Single Father Poverty Comparison
Central American Indians
Ethiopians
21.7%
SINGLE FATHER POVERTY
0.0/ 100
METRIC RATING
331st/ 347
METRIC RANK
13.5%
SINGLE FATHER POVERTY
100.0/ 100
METRIC RATING
6th/ 347
METRIC RANK
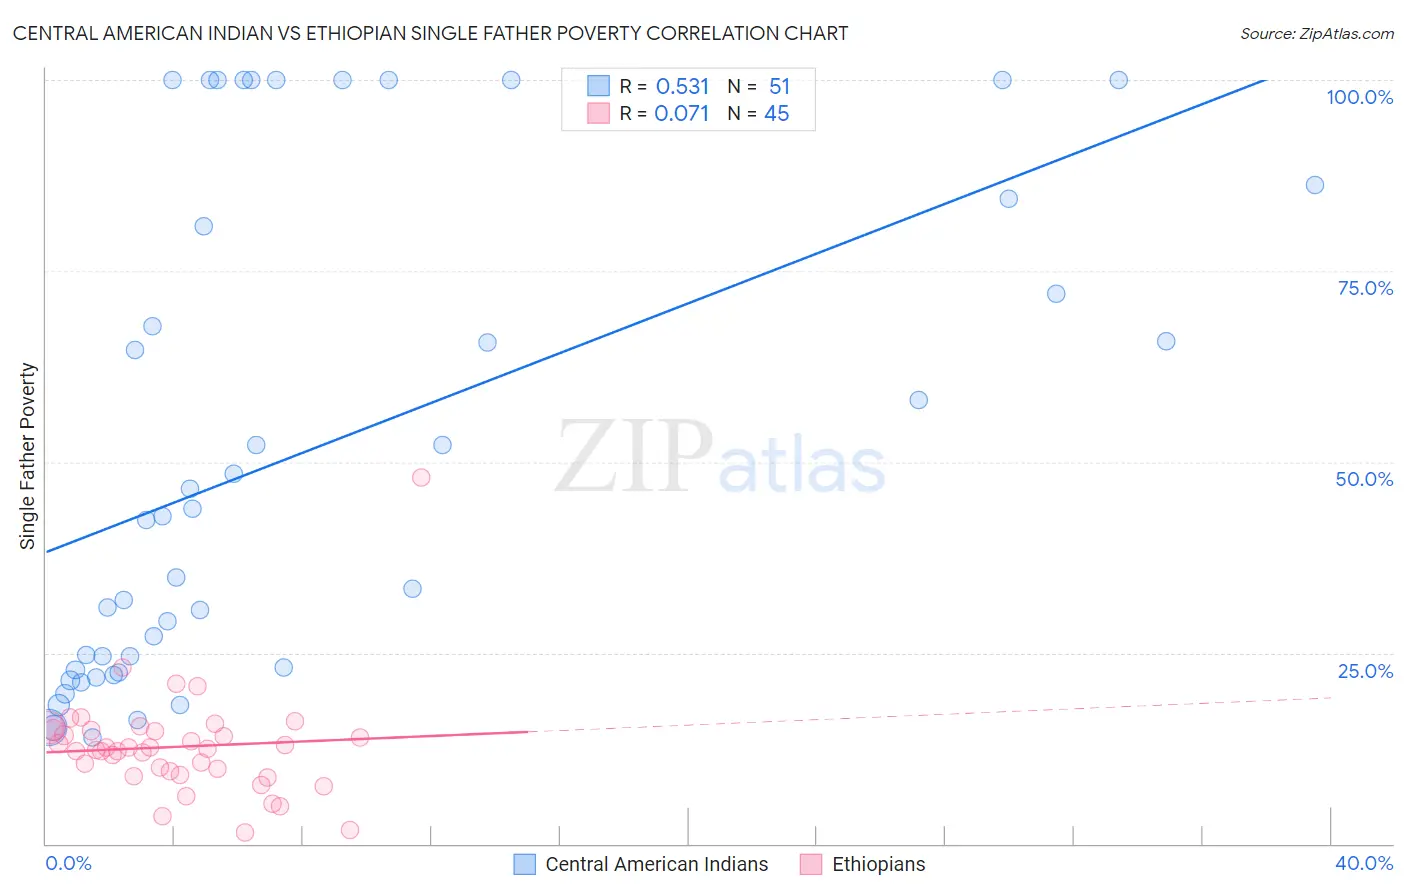
Central American Indian vs Ethiopian Single Father Poverty Correlation Chart
The statistical analysis conducted on geographies consisting of 271,383,000 people shows a substantial positive correlation between the proportion of Central American Indians and poverty level among single fathers in the United States with a correlation coefficient (R) of 0.531 and weighted average of 21.7%. Similarly, the statistical analysis conducted on geographies consisting of 191,994,116 people shows a slight positive correlation between the proportion of Ethiopians and poverty level among single fathers in the United States with a correlation coefficient (R) of 0.071 and weighted average of 13.5%, a difference of 60.1%.
Single Father Poverty Correlation Summary
| Measurement | Central American Indian | Ethiopian |
| Minimum | 13.9% | 1.5% |
| Maximum | 100.0% | 48.0% |
| Range | 86.1% | 46.5% |
| Mean | 51.7% | 12.7% |
| Median | 42.9% | 12.4% |
| Interquartile 25% (IQ1) | 22.7% | 9.3% |
| Interquartile 75% (IQ3) | 84.4% | 14.8% |
| Interquartile Range (IQR) | 61.6% | 5.6% |
| Standard Deviation (Sample) | 31.7% | 7.0% |
| Standard Deviation (Population) | 31.4% | 7.0% |
Similar Demographics by Single Father Poverty
Demographics Similar to Central American Indians by Single Father Poverty
In terms of single father poverty, the demographic groups most similar to Central American Indians are Paiute (21.6%, a difference of 0.27%), Tohono O'odham (22.0%, a difference of 1.5%), Colville (21.4%, a difference of 1.5%), Pueblo (21.1%, a difference of 2.6%), and Native/Alaskan (22.4%, a difference of 3.3%).
| Demographics | Rating | Rank | Single Father Poverty |
| Americans | 0.0 /100 | #324 | Tragic 20.1% |
| Blacks/African Americans | 0.0 /100 | #325 | Tragic 20.4% |
| Immigrants | Yemen | 0.0 /100 | #326 | Tragic 20.6% |
| Choctaw | 0.0 /100 | #327 | Tragic 20.7% |
| Pueblo | 0.0 /100 | #328 | Tragic 21.1% |
| Colville | 0.0 /100 | #329 | Tragic 21.4% |
| Paiute | 0.0 /100 | #330 | Tragic 21.6% |
| Central American Indians | 0.0 /100 | #331 | Tragic 21.7% |
| Tohono O'odham | 0.0 /100 | #332 | Tragic 22.0% |
| Natives/Alaskans | 0.0 /100 | #333 | Tragic 22.4% |
| Kiowa | 0.0 /100 | #334 | Tragic 22.5% |
| Shoshone | 0.0 /100 | #335 | Tragic 22.9% |
| Cajuns | 0.0 /100 | #336 | Tragic 23.1% |
| Sioux | 0.0 /100 | #337 | Tragic 23.9% |
| Arapaho | 0.0 /100 | #338 | Tragic 24.0% |
Demographics Similar to Ethiopians by Single Father Poverty
In terms of single father poverty, the demographic groups most similar to Ethiopians are Immigrants from Ethiopia (13.4%, a difference of 0.77%), Immigrants from Taiwan (13.7%, a difference of 1.1%), Samoan (13.8%, a difference of 1.9%), Immigrants from Fiji (13.2%, a difference of 2.3%), and Afghan (14.0%, a difference of 3.0%).
| Demographics | Rating | Rank | Single Father Poverty |
| Assyrians/Chaldeans/Syriacs | 100.0 /100 | #1 | Exceptional 11.7% |
| Tongans | 100.0 /100 | #2 | Exceptional 12.2% |
| Tsimshian | 100.0 /100 | #3 | Exceptional 12.7% |
| Immigrants | Fiji | 100.0 /100 | #4 | Exceptional 13.2% |
| Immigrants | Ethiopia | 100.0 /100 | #5 | Exceptional 13.4% |
| Ethiopians | 100.0 /100 | #6 | Exceptional 13.5% |
| Immigrants | Taiwan | 100.0 /100 | #7 | Exceptional 13.7% |
| Samoans | 100.0 /100 | #8 | Exceptional 13.8% |
| Afghans | 100.0 /100 | #9 | Exceptional 14.0% |
| Koreans | 100.0 /100 | #10 | Exceptional 14.0% |
| Filipinos | 100.0 /100 | #11 | Exceptional 14.0% |
| Immigrants | India | 100.0 /100 | #12 | Exceptional 14.0% |
| Immigrants | Philippines | 100.0 /100 | #13 | Exceptional 14.0% |
| Immigrants | Vietnam | 100.0 /100 | #14 | Exceptional 14.1% |
| Sri Lankans | 100.0 /100 | #15 | Exceptional 14.2% |