Danish vs Bahamian Single Father Poverty
COMPARE
Danish
Bahamian
Single Father Poverty
Single Father Poverty Comparison
Danes
Bahamians
15.8%
SINGLE FATHER POVERTY
94.5/ 100
METRIC RATING
113th/ 347
METRIC RANK
18.0%
SINGLE FATHER POVERTY
0.0/ 100
METRIC RATING
288th/ 347
METRIC RANK
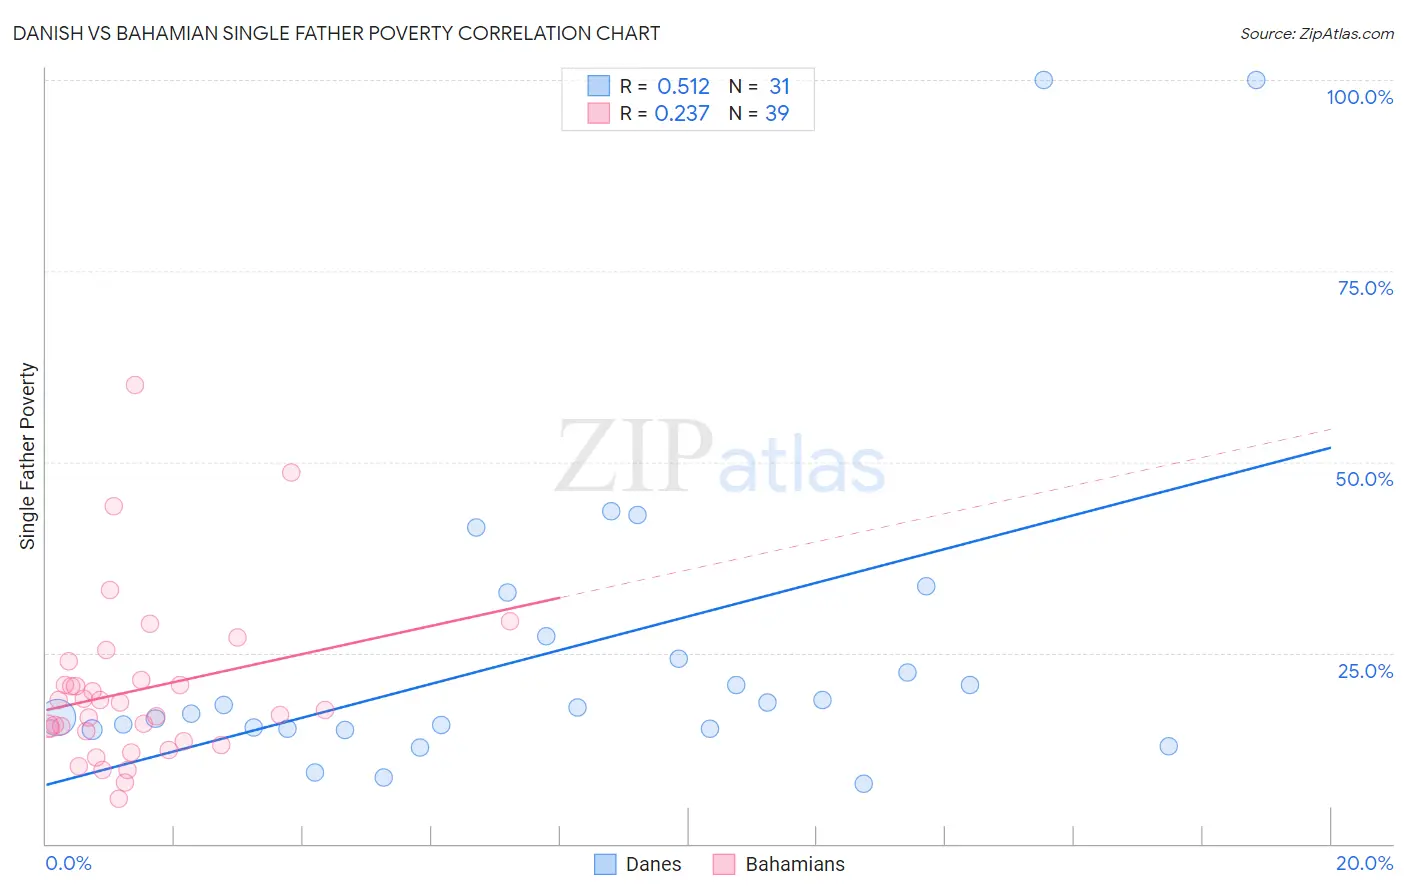
Danish vs Bahamian Single Father Poverty Correlation Chart
The statistical analysis conducted on geographies consisting of 352,960,899 people shows a substantial positive correlation between the proportion of Danes and poverty level among single fathers in the United States with a correlation coefficient (R) of 0.512 and weighted average of 15.8%. Similarly, the statistical analysis conducted on geographies consisting of 102,772,098 people shows a weak positive correlation between the proportion of Bahamians and poverty level among single fathers in the United States with a correlation coefficient (R) of 0.237 and weighted average of 18.0%, a difference of 13.8%.
Single Father Poverty Correlation Summary
| Measurement | Danish | Bahamian |
| Minimum | 7.9% | 6.0% |
| Maximum | 100.0% | 60.0% |
| Range | 92.1% | 54.0% |
| Mean | 25.5% | 20.1% |
| Median | 17.9% | 17.6% |
| Interquartile 25% (IQ1) | 15.1% | 13.4% |
| Interquartile 75% (IQ3) | 27.1% | 21.5% |
| Interquartile Range (IQR) | 12.0% | 8.0% |
| Standard Deviation (Sample) | 22.0% | 10.9% |
| Standard Deviation (Population) | 21.6% | 10.8% |
Similar Demographics by Single Father Poverty
Demographics Similar to Danes by Single Father Poverty
In terms of single father poverty, the demographic groups most similar to Danes are Argentinean (15.8%, a difference of 0.020%), Immigrants from Latvia (15.8%, a difference of 0.040%), Bulgarian (15.8%, a difference of 0.080%), Immigrants from Africa (15.8%, a difference of 0.13%), and Turkish (15.8%, a difference of 0.14%).
| Demographics | Rating | Rank | Single Father Poverty |
| Immigrants | Poland | 95.8 /100 | #106 | Exceptional 15.7% |
| Native Hawaiians | 95.8 /100 | #107 | Exceptional 15.7% |
| Pakistanis | 95.7 /100 | #108 | Exceptional 15.7% |
| Turks | 95.1 /100 | #109 | Exceptional 15.8% |
| Immigrants | Africa | 95.1 /100 | #110 | Exceptional 15.8% |
| Bulgarians | 94.8 /100 | #111 | Exceptional 15.8% |
| Immigrants | Latvia | 94.7 /100 | #112 | Exceptional 15.8% |
| Danes | 94.5 /100 | #113 | Exceptional 15.8% |
| Argentineans | 94.4 /100 | #114 | Exceptional 15.8% |
| Immigrants | Thailand | 93.6 /100 | #115 | Exceptional 15.8% |
| Immigrants | Argentina | 92.8 /100 | #116 | Exceptional 15.8% |
| Immigrants | Colombia | 92.6 /100 | #117 | Exceptional 15.8% |
| Immigrants | Eastern Europe | 92.5 /100 | #118 | Exceptional 15.8% |
| Immigrants | Belarus | 92.4 /100 | #119 | Exceptional 15.8% |
| Uruguayans | 92.1 /100 | #120 | Exceptional 15.9% |
Demographics Similar to Bahamians by Single Father Poverty
In terms of single father poverty, the demographic groups most similar to Bahamians are Carpatho Rusyn (18.0%, a difference of 0.020%), Immigrants from North Macedonia (17.9%, a difference of 0.25%), Immigrants from Lebanon (17.9%, a difference of 0.42%), Irish (18.0%, a difference of 0.44%), and West Indian (18.0%, a difference of 0.47%).
| Demographics | Rating | Rank | Single Father Poverty |
| English | 0.0 /100 | #281 | Tragic 17.8% |
| Dutch | 0.0 /100 | #282 | Tragic 17.8% |
| Alsatians | 0.0 /100 | #283 | Tragic 17.8% |
| Welsh | 0.0 /100 | #284 | Tragic 17.8% |
| Immigrants | Lebanon | 0.0 /100 | #285 | Tragic 17.9% |
| Immigrants | North Macedonia | 0.0 /100 | #286 | Tragic 17.9% |
| Carpatho Rusyns | 0.0 /100 | #287 | Tragic 18.0% |
| Bahamians | 0.0 /100 | #288 | Tragic 18.0% |
| Irish | 0.0 /100 | #289 | Tragic 18.0% |
| West Indians | 0.0 /100 | #290 | Tragic 18.0% |
| Alaskan Athabascans | 0.0 /100 | #291 | Tragic 18.1% |
| Immigrants | Bahamas | 0.0 /100 | #292 | Tragic 18.1% |
| Alaska Natives | 0.0 /100 | #293 | Tragic 18.1% |
| U.S. Virgin Islanders | 0.0 /100 | #294 | Tragic 18.1% |
| Yakama | 0.0 /100 | #295 | Tragic 18.1% |