Central American Indian vs Bahamian Family Households with Children
COMPARE
Central American Indian
Bahamian
Family Households with Children
Family Households with Children Comparison
Central American Indians
Bahamians
27.9%
FAMILY HOUSEHOLDS WITH CHILDREN
95.9/ 100
METRIC RATING
118th/ 347
METRIC RANK
26.5%
FAMILY HOUSEHOLDS WITH CHILDREN
0.2/ 100
METRIC RATING
291st/ 347
METRIC RANK
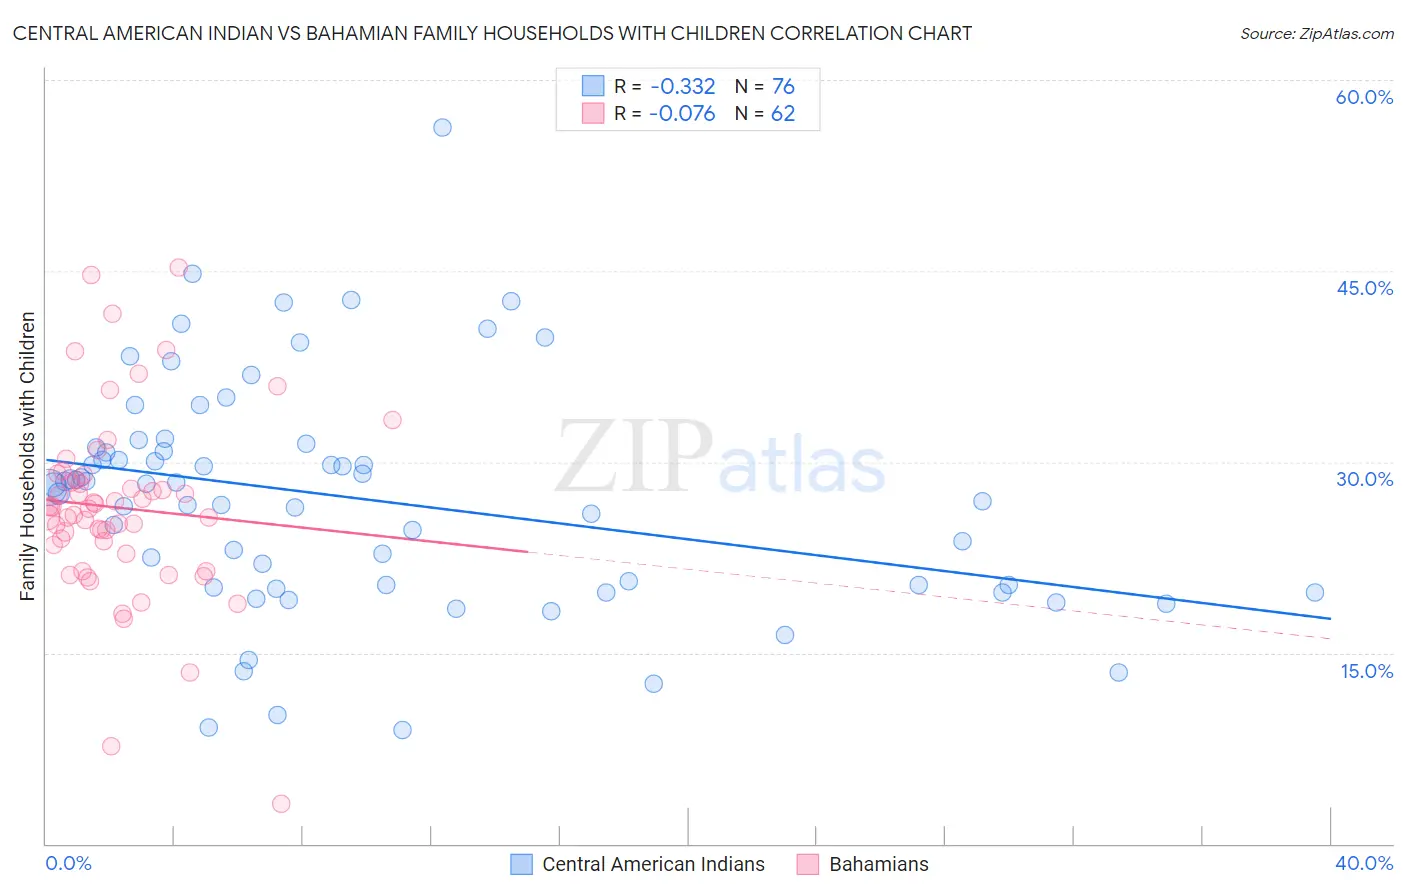
Central American Indian vs Bahamian Family Households with Children Correlation Chart
The statistical analysis conducted on geographies consisting of 326,008,789 people shows a mild negative correlation between the proportion of Central American Indians and percentage of family households with children in the United States with a correlation coefficient (R) of -0.332 and weighted average of 27.9%. Similarly, the statistical analysis conducted on geographies consisting of 112,612,405 people shows a slight negative correlation between the proportion of Bahamians and percentage of family households with children in the United States with a correlation coefficient (R) of -0.076 and weighted average of 26.5%, a difference of 5.5%.
Family Households with Children Correlation Summary
| Measurement | Central American Indian | Bahamian |
| Minimum | 9.0% | 3.2% |
| Maximum | 56.2% | 45.3% |
| Range | 47.2% | 42.1% |
| Mean | 27.1% | 26.4% |
| Median | 28.1% | 26.4% |
| Interquartile 25% (IQ1) | 20.2% | 23.5% |
| Interquartile 75% (IQ3) | 31.0% | 28.6% |
| Interquartile Range (IQR) | 10.8% | 5.1% |
| Standard Deviation (Sample) | 9.0% | 7.3% |
| Standard Deviation (Population) | 8.9% | 7.2% |
Similar Demographics by Family Households with Children
Demographics Similar to Central American Indians by Family Households with Children
In terms of family households with children, the demographic groups most similar to Central American Indians are Immigrants from Malaysia (27.9%, a difference of 0.0%), Pakistani (27.9%, a difference of 0.010%), Zimbabwean (27.9%, a difference of 0.040%), European (27.9%, a difference of 0.070%), and Immigrants from Africa (28.0%, a difference of 0.14%).
| Demographics | Rating | Rank | Family Households with Children |
| Scandinavians | 97.1 /100 | #111 | Exceptional 28.0% |
| Immigrants | Middle Africa | 97.0 /100 | #112 | Exceptional 28.0% |
| Arabs | 97.0 /100 | #113 | Exceptional 28.0% |
| South American Indians | 96.9 /100 | #114 | Exceptional 28.0% |
| Immigrants | Africa | 96.8 /100 | #115 | Exceptional 28.0% |
| Pakistanis | 96.0 /100 | #116 | Exceptional 27.9% |
| Immigrants | Malaysia | 95.9 /100 | #117 | Exceptional 27.9% |
| Central American Indians | 95.9 /100 | #118 | Exceptional 27.9% |
| Zimbabweans | 95.6 /100 | #119 | Exceptional 27.9% |
| Europeans | 95.4 /100 | #120 | Exceptional 27.9% |
| Immigrants | Western Asia | 93.6 /100 | #121 | Exceptional 27.9% |
| Immigrants | Zimbabwe | 92.8 /100 | #122 | Exceptional 27.8% |
| Immigrants | Northern Africa | 91.8 /100 | #123 | Exceptional 27.8% |
| Immigrants | Singapore | 90.8 /100 | #124 | Exceptional 27.8% |
| Ecuadorians | 90.8 /100 | #125 | Exceptional 27.8% |
Demographics Similar to Bahamians by Family Households with Children
In terms of family households with children, the demographic groups most similar to Bahamians are Albanian (26.5%, a difference of 0.010%), Polish (26.5%, a difference of 0.010%), Black/African American (26.5%, a difference of 0.060%), Immigrants from Sweden (26.5%, a difference of 0.12%), and Latvian (26.4%, a difference of 0.12%).
| Demographics | Rating | Rank | Family Households with Children |
| Immigrants | Canada | 0.3 /100 | #284 | Tragic 26.5% |
| Cambodians | 0.2 /100 | #285 | Tragic 26.5% |
| Immigrants | Senegal | 0.2 /100 | #286 | Tragic 26.5% |
| Shoshone | 0.2 /100 | #287 | Tragic 26.5% |
| Russians | 0.2 /100 | #288 | Tragic 26.5% |
| Immigrants | Sweden | 0.2 /100 | #289 | Tragic 26.5% |
| Albanians | 0.2 /100 | #290 | Tragic 26.5% |
| Bahamians | 0.2 /100 | #291 | Tragic 26.5% |
| Poles | 0.2 /100 | #292 | Tragic 26.5% |
| Blacks/African Americans | 0.1 /100 | #293 | Tragic 26.5% |
| Latvians | 0.1 /100 | #294 | Tragic 26.4% |
| Macedonians | 0.1 /100 | #295 | Tragic 26.4% |
| Croatians | 0.1 /100 | #296 | Tragic 26.4% |
| Armenians | 0.1 /100 | #297 | Tragic 26.4% |
| Immigrants | Western Europe | 0.1 /100 | #298 | Tragic 26.4% |