Central American Indian vs Bahamian In Labor Force | Age 20-64
COMPARE
Central American Indian
Bahamian
In Labor Force | Age 20-64
In Labor Force | Age 20-64 Comparison
Central American Indians
Bahamians
77.1%
IN LABOR FORCE | AGE 20-64
0.0/ 100
METRIC RATING
307th/ 347
METRIC RANK
78.4%
IN LABOR FORCE | AGE 20-64
0.1/ 100
METRIC RATING
266th/ 347
METRIC RANK
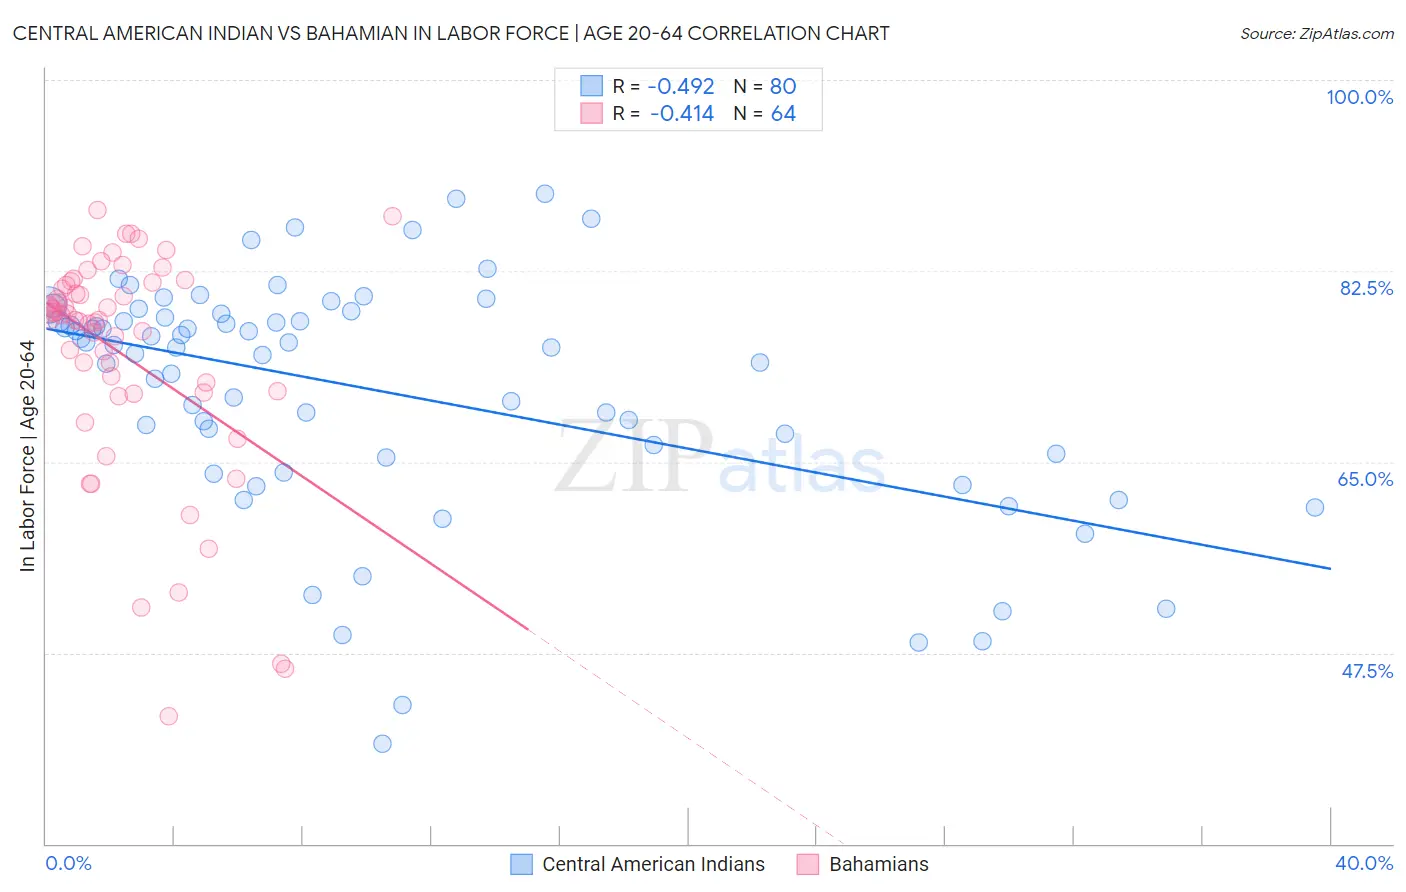
Central American Indian vs Bahamian In Labor Force | Age 20-64 Correlation Chart
The statistical analysis conducted on geographies consisting of 326,143,757 people shows a moderate negative correlation between the proportion of Central American Indians and labor force participation rate among population between the ages 20 and 64 in the United States with a correlation coefficient (R) of -0.492 and weighted average of 77.1%. Similarly, the statistical analysis conducted on geographies consisting of 112,707,980 people shows a moderate negative correlation between the proportion of Bahamians and labor force participation rate among population between the ages 20 and 64 in the United States with a correlation coefficient (R) of -0.414 and weighted average of 78.4%, a difference of 1.7%.
In Labor Force | Age 20-64 Correlation Summary
| Measurement | Central American Indian | Bahamian |
| Minimum | 39.2% | 41.7% |
| Maximum | 89.6% | 88.1% |
| Range | 50.4% | 46.4% |
| Mean | 71.6% | 74.8% |
| Median | 75.6% | 78.3% |
| Interquartile 25% (IQ1) | 65.6% | 71.5% |
| Interquartile 75% (IQ3) | 78.4% | 81.3% |
| Interquartile Range (IQR) | 12.7% | 9.8% |
| Standard Deviation (Sample) | 10.9% | 10.4% |
| Standard Deviation (Population) | 10.8% | 10.3% |
Similar Demographics by In Labor Force | Age 20-64
Demographics Similar to Central American Indians by In Labor Force | Age 20-64
In terms of in labor force | age 20-64, the demographic groups most similar to Central American Indians are Alaska Native (77.0%, a difference of 0.060%), American (77.0%, a difference of 0.060%), Comanche (77.0%, a difference of 0.080%), Blackfeet (77.0%, a difference of 0.11%), and Potawatomi (77.2%, a difference of 0.17%).
| Demographics | Rating | Rank | In Labor Force | Age 20-64 |
| Spanish American Indians | 0.0 /100 | #300 | Tragic 77.6% |
| Nepalese | 0.0 /100 | #301 | Tragic 77.5% |
| Iroquois | 0.0 /100 | #302 | Tragic 77.5% |
| Chippewa | 0.0 /100 | #303 | Tragic 77.3% |
| Immigrants | Mexico | 0.0 /100 | #304 | Tragic 77.3% |
| Mexicans | 0.0 /100 | #305 | Tragic 77.2% |
| Potawatomi | 0.0 /100 | #306 | Tragic 77.2% |
| Central American Indians | 0.0 /100 | #307 | Tragic 77.1% |
| Alaska Natives | 0.0 /100 | #308 | Tragic 77.0% |
| Americans | 0.0 /100 | #309 | Tragic 77.0% |
| Comanche | 0.0 /100 | #310 | Tragic 77.0% |
| Blackfeet | 0.0 /100 | #311 | Tragic 77.0% |
| Alaskan Athabascans | 0.0 /100 | #312 | Tragic 76.9% |
| Shoshone | 0.0 /100 | #313 | Tragic 76.8% |
| Blacks/African Americans | 0.0 /100 | #314 | Tragic 76.8% |
Demographics Similar to Bahamians by In Labor Force | Age 20-64
In terms of in labor force | age 20-64, the demographic groups most similar to Bahamians are British West Indian (78.4%, a difference of 0.010%), U.S. Virgin Islander (78.4%, a difference of 0.020%), West Indian (78.3%, a difference of 0.040%), Pennsylvania German (78.4%, a difference of 0.050%), and Spaniard (78.4%, a difference of 0.050%).
| Demographics | Rating | Rank | In Labor Force | Age 20-64 |
| Tsimshian | 0.4 /100 | #259 | Tragic 78.7% |
| Immigrants | Fiji | 0.3 /100 | #260 | Tragic 78.6% |
| Whites/Caucasians | 0.2 /100 | #261 | Tragic 78.5% |
| Fijians | 0.1 /100 | #262 | Tragic 78.4% |
| Pennsylvania Germans | 0.1 /100 | #263 | Tragic 78.4% |
| Spaniards | 0.1 /100 | #264 | Tragic 78.4% |
| British West Indians | 0.1 /100 | #265 | Tragic 78.4% |
| Bahamians | 0.1 /100 | #266 | Tragic 78.4% |
| U.S. Virgin Islanders | 0.1 /100 | #267 | Tragic 78.4% |
| West Indians | 0.0 /100 | #268 | Tragic 78.3% |
| Immigrants | Barbados | 0.0 /100 | #269 | Tragic 78.3% |
| Scotch-Irish | 0.0 /100 | #270 | Tragic 78.3% |
| Immigrants | Latin America | 0.0 /100 | #271 | Tragic 78.3% |
| Marshallese | 0.0 /100 | #272 | Tragic 78.3% |
| French American Indians | 0.0 /100 | #273 | Tragic 78.2% |