Central American Indian vs Croatian Single Father Poverty
COMPARE
Central American Indian
Croatian
Single Father Poverty
Single Father Poverty Comparison
Central American Indians
Croatians
21.7%
SINGLE FATHER POVERTY
0.0/ 100
METRIC RATING
331st/ 347
METRIC RANK
17.1%
SINGLE FATHER POVERTY
1.0/ 100
METRIC RATING
252nd/ 347
METRIC RANK
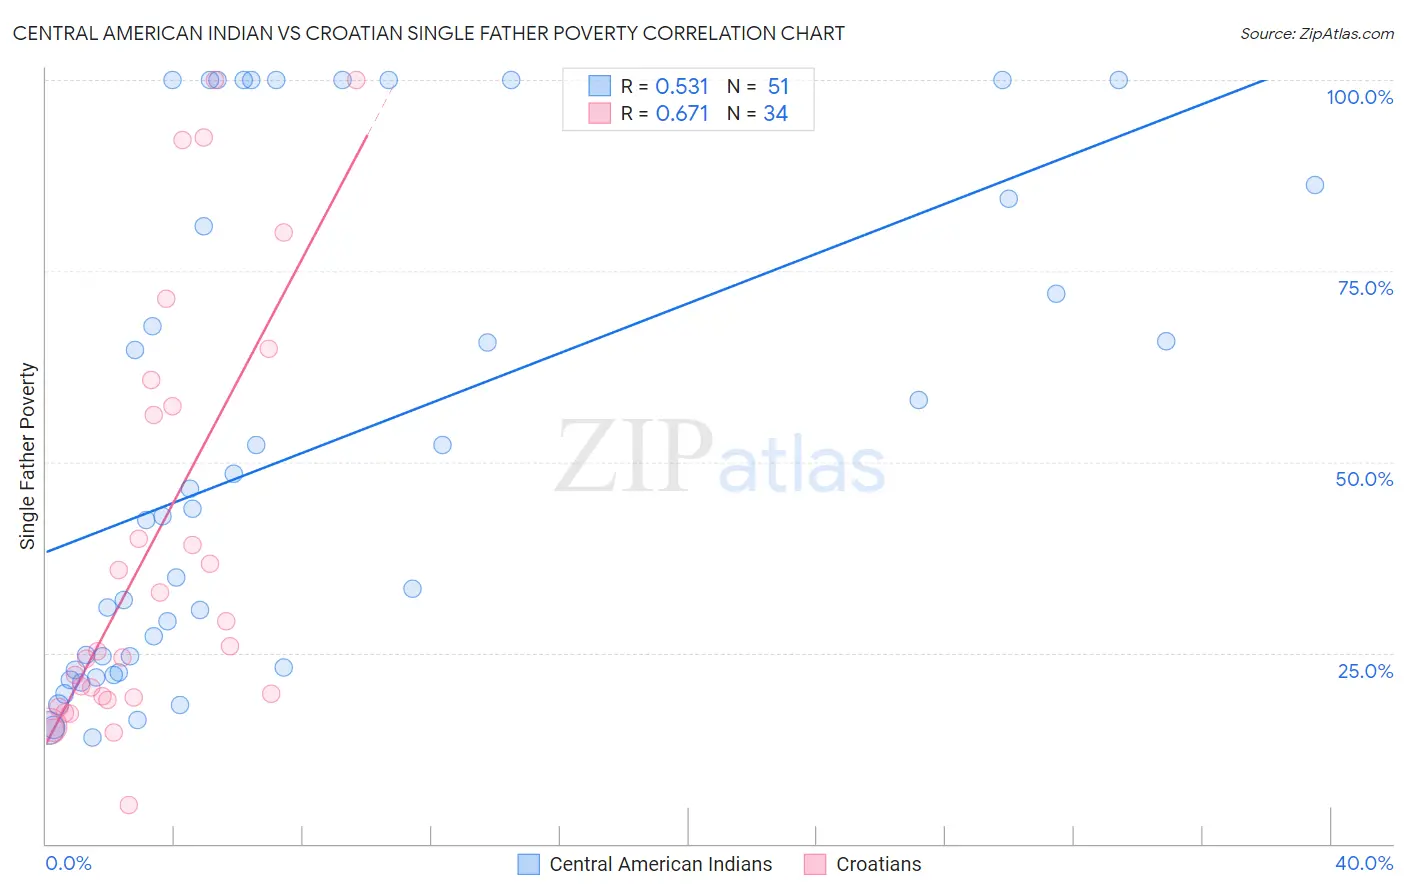
Central American Indian vs Croatian Single Father Poverty Correlation Chart
The statistical analysis conducted on geographies consisting of 271,383,000 people shows a substantial positive correlation between the proportion of Central American Indians and poverty level among single fathers in the United States with a correlation coefficient (R) of 0.531 and weighted average of 21.7%. Similarly, the statistical analysis conducted on geographies consisting of 290,349,710 people shows a significant positive correlation between the proportion of Croatians and poverty level among single fathers in the United States with a correlation coefficient (R) of 0.671 and weighted average of 17.1%, a difference of 26.7%.
Single Father Poverty Correlation Summary
| Measurement | Central American Indian | Croatian |
| Minimum | 13.9% | 5.0% |
| Maximum | 100.0% | 100.0% |
| Range | 86.1% | 95.0% |
| Mean | 51.7% | 39.1% |
| Median | 42.9% | 25.6% |
| Interquartile 25% (IQ1) | 22.7% | 19.1% |
| Interquartile 75% (IQ3) | 84.4% | 57.3% |
| Interquartile Range (IQR) | 61.6% | 38.2% |
| Standard Deviation (Sample) | 31.7% | 27.7% |
| Standard Deviation (Population) | 31.4% | 27.3% |
Similar Demographics by Single Father Poverty
Demographics Similar to Central American Indians by Single Father Poverty
In terms of single father poverty, the demographic groups most similar to Central American Indians are Paiute (21.6%, a difference of 0.27%), Tohono O'odham (22.0%, a difference of 1.5%), Colville (21.4%, a difference of 1.5%), Pueblo (21.1%, a difference of 2.6%), and Native/Alaskan (22.4%, a difference of 3.3%).
| Demographics | Rating | Rank | Single Father Poverty |
| Americans | 0.0 /100 | #324 | Tragic 20.1% |
| Blacks/African Americans | 0.0 /100 | #325 | Tragic 20.4% |
| Immigrants | Yemen | 0.0 /100 | #326 | Tragic 20.6% |
| Choctaw | 0.0 /100 | #327 | Tragic 20.7% |
| Pueblo | 0.0 /100 | #328 | Tragic 21.1% |
| Colville | 0.0 /100 | #329 | Tragic 21.4% |
| Paiute | 0.0 /100 | #330 | Tragic 21.6% |
| Central American Indians | 0.0 /100 | #331 | Tragic 21.7% |
| Tohono O'odham | 0.0 /100 | #332 | Tragic 22.0% |
| Natives/Alaskans | 0.0 /100 | #333 | Tragic 22.4% |
| Kiowa | 0.0 /100 | #334 | Tragic 22.5% |
| Shoshone | 0.0 /100 | #335 | Tragic 22.9% |
| Cajuns | 0.0 /100 | #336 | Tragic 23.1% |
| Sioux | 0.0 /100 | #337 | Tragic 23.9% |
| Arapaho | 0.0 /100 | #338 | Tragic 24.0% |
Demographics Similar to Croatians by Single Father Poverty
In terms of single father poverty, the demographic groups most similar to Croatians are Cree (17.1%, a difference of 0.010%), Luxembourger (17.1%, a difference of 0.10%), Austrian (17.1%, a difference of 0.11%), Immigrants from Honduras (17.1%, a difference of 0.12%), and Canadian (17.1%, a difference of 0.24%).
| Demographics | Rating | Rank | Single Father Poverty |
| Trinidadians and Tobagonians | 1.5 /100 | #245 | Tragic 17.0% |
| Immigrants | Ireland | 1.4 /100 | #246 | Tragic 17.1% |
| Greeks | 1.3 /100 | #247 | Tragic 17.1% |
| Czechoslovakians | 1.3 /100 | #248 | Tragic 17.1% |
| Canadians | 1.3 /100 | #249 | Tragic 17.1% |
| Austrians | 1.1 /100 | #250 | Tragic 17.1% |
| Luxembourgers | 1.1 /100 | #251 | Tragic 17.1% |
| Croatians | 1.0 /100 | #252 | Tragic 17.1% |
| Cree | 1.0 /100 | #253 | Tragic 17.1% |
| Immigrants | Honduras | 0.9 /100 | #254 | Tragic 17.1% |
| Sierra Leoneans | 0.8 /100 | #255 | Tragic 17.2% |
| Immigrants | Haiti | 0.8 /100 | #256 | Tragic 17.2% |
| Immigrants | Albania | 0.7 /100 | #257 | Tragic 17.2% |
| Albanians | 0.7 /100 | #258 | Tragic 17.2% |
| Immigrants | Jamaica | 0.7 /100 | #259 | Tragic 17.2% |