Immigrants from Armenia vs Immigrants from Japan Single Father Poverty
COMPARE
Immigrants from Armenia
Immigrants from Japan
Single Father Poverty
Single Father Poverty Comparison
Immigrants from Armenia
Immigrants from Japan
15.2%
SINGLE FATHER POVERTY
99.8/ 100
METRIC RATING
62nd/ 347
METRIC RANK
15.3%
SINGLE FATHER POVERTY
99.5/ 100
METRIC RATING
76th/ 347
METRIC RANK
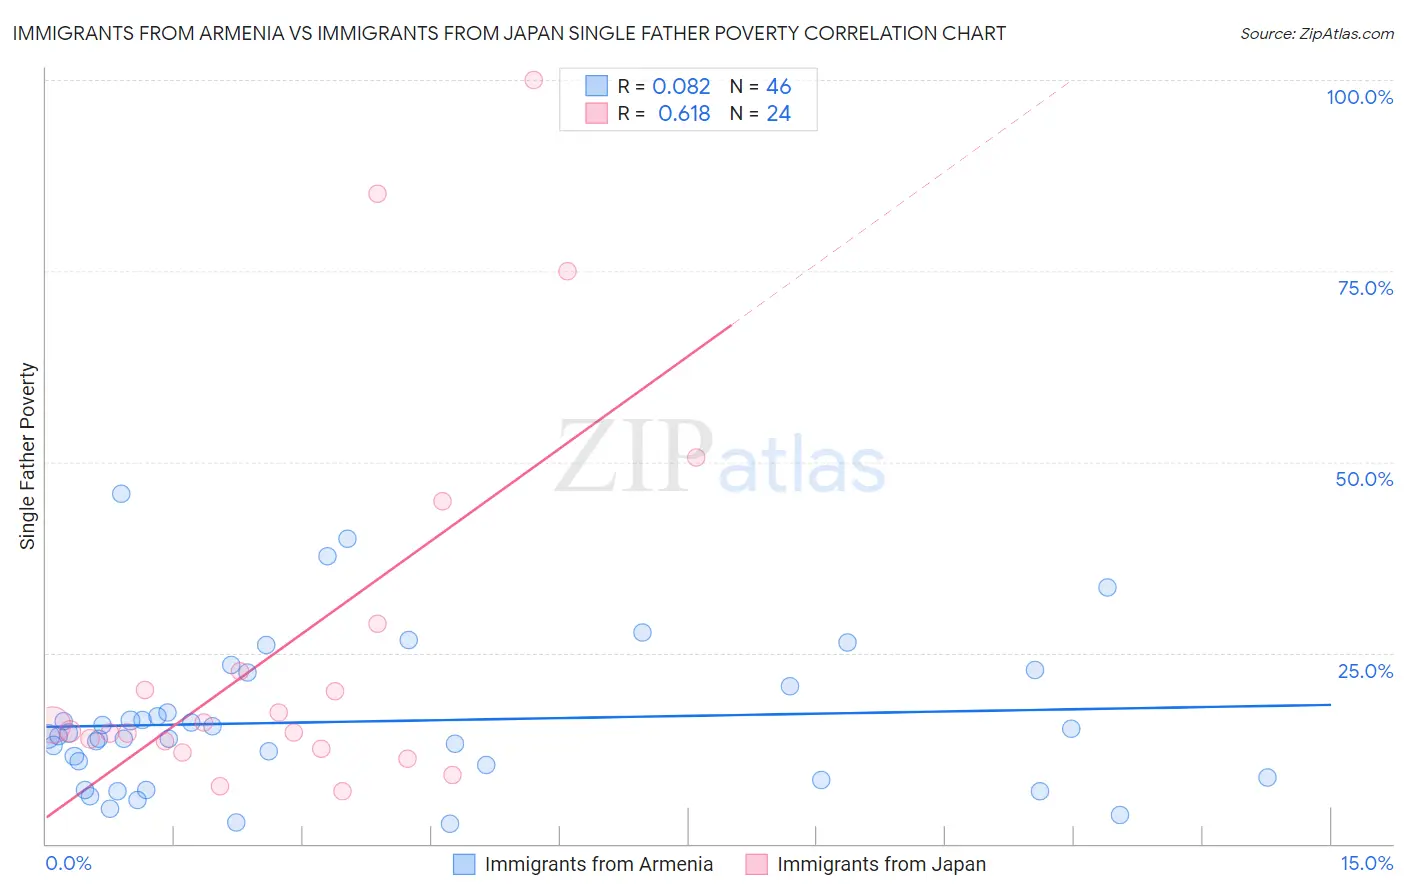
Immigrants from Armenia vs Immigrants from Japan Single Father Poverty Correlation Chart
The statistical analysis conducted on geographies consisting of 86,819,015 people shows a slight positive correlation between the proportion of Immigrants from Armenia and poverty level among single fathers in the United States with a correlation coefficient (R) of 0.082 and weighted average of 15.2%. Similarly, the statistical analysis conducted on geographies consisting of 272,248,518 people shows a significant positive correlation between the proportion of Immigrants from Japan and poverty level among single fathers in the United States with a correlation coefficient (R) of 0.618 and weighted average of 15.3%, a difference of 1.1%.
Single Father Poverty Correlation Summary
| Measurement | Immigrants from Armenia | Immigrants from Japan |
| Minimum | 2.6% | 7.0% |
| Maximum | 45.8% | 100.0% |
| Range | 43.2% | 93.0% |
| Mean | 16.0% | 26.7% |
| Median | 14.1% | 15.1% |
| Interquartile 25% (IQ1) | 8.7% | 12.9% |
| Interquartile 75% (IQ3) | 20.6% | 25.6% |
| Interquartile Range (IQR) | 11.9% | 12.7% |
| Standard Deviation (Sample) | 9.8% | 25.6% |
| Standard Deviation (Population) | 9.6% | 25.1% |
Demographics Similar to Immigrants from Armenia and Immigrants from Japan by Single Father Poverty
In terms of single father poverty, the demographic groups most similar to Immigrants from Armenia are Immigrants from Bosnia and Herzegovina (15.2%, a difference of 0.010%), Puget Sound Salish (15.2%, a difference of 0.050%), Immigrants from Sweden (15.2%, a difference of 0.090%), Bangladeshi (15.2%, a difference of 0.17%), and Immigrants from Malaysia (15.2%, a difference of 0.26%). Similarly, the demographic groups most similar to Immigrants from Japan are Immigrants from Peru (15.3%, a difference of 0.010%), Tlingit-Haida (15.3%, a difference of 0.060%), Immigrants from Turkey (15.3%, a difference of 0.080%), Immigrants from Northern Africa (15.3%, a difference of 0.080%), and Maltese (15.3%, a difference of 0.10%).
| Demographics | Rating | Rank | Single Father Poverty |
| Guamanians/Chamorros | 99.9 /100 | #59 | Exceptional 15.1% |
| Puget Sound Salish | 99.8 /100 | #60 | Exceptional 15.2% |
| Immigrants | Bosnia and Herzegovina | 99.8 /100 | #61 | Exceptional 15.2% |
| Immigrants | Armenia | 99.8 /100 | #62 | Exceptional 15.2% |
| Immigrants | Sweden | 99.8 /100 | #63 | Exceptional 15.2% |
| Bangladeshis | 99.8 /100 | #64 | Exceptional 15.2% |
| Immigrants | Malaysia | 99.8 /100 | #65 | Exceptional 15.2% |
| Immigrants | Moldova | 99.8 /100 | #66 | Exceptional 15.2% |
| Paraguayans | 99.7 /100 | #67 | Exceptional 15.2% |
| Immigrants | Cameroon | 99.7 /100 | #68 | Exceptional 15.2% |
| Japanese | 99.7 /100 | #69 | Exceptional 15.2% |
| Mongolians | 99.7 /100 | #70 | Exceptional 15.3% |
| Immigrants | Brazil | 99.6 /100 | #71 | Exceptional 15.3% |
| Immigrants | Lithuania | 99.6 /100 | #72 | Exceptional 15.3% |
| Kenyans | 99.6 /100 | #73 | Exceptional 15.3% |
| Maltese | 99.6 /100 | #74 | Exceptional 15.3% |
| Immigrants | Turkey | 99.5 /100 | #75 | Exceptional 15.3% |
| Immigrants | Japan | 99.5 /100 | #76 | Exceptional 15.3% |
| Immigrants | Peru | 99.5 /100 | #77 | Exceptional 15.3% |
| Tlingit-Haida | 99.5 /100 | #78 | Exceptional 15.3% |
| Immigrants | Northern Africa | 99.5 /100 | #79 | Exceptional 15.3% |