Celtic vs Immigrants from Japan 10th Grade
COMPARE
Celtic
Immigrants from Japan
10th Grade
10th Grade Comparison
Celtics
Immigrants from Japan
95.0%
10TH GRADE
99.8/ 100
METRIC RATING
59th/ 347
METRIC RANK
94.7%
10TH GRADE
99.0/ 100
METRIC RATING
88th/ 347
METRIC RANK
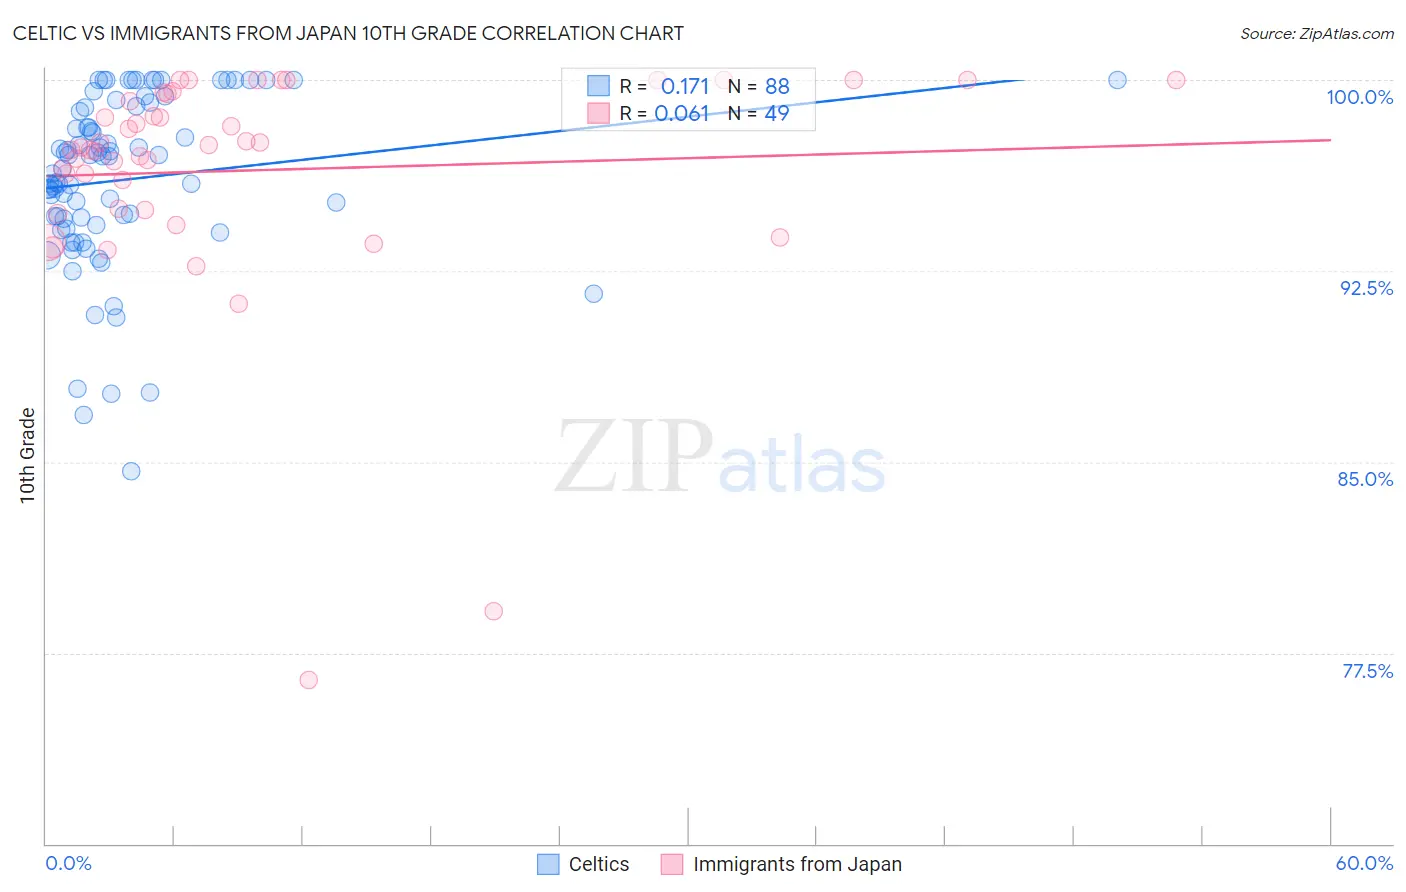
Celtic vs Immigrants from Japan 10th Grade Correlation Chart
The statistical analysis conducted on geographies consisting of 168,876,981 people shows a poor positive correlation between the proportion of Celtics and percentage of population with at least 10th grade education in the United States with a correlation coefficient (R) of 0.171 and weighted average of 95.0%. Similarly, the statistical analysis conducted on geographies consisting of 340,148,942 people shows a slight positive correlation between the proportion of Immigrants from Japan and percentage of population with at least 10th grade education in the United States with a correlation coefficient (R) of 0.061 and weighted average of 94.7%, a difference of 0.34%.
10th Grade Correlation Summary
| Measurement | Celtic | Immigrants from Japan |
| Minimum | 84.6% | 76.5% |
| Maximum | 100.0% | 100.0% |
| Range | 15.4% | 23.5% |
| Mean | 96.1% | 96.4% |
| Median | 96.8% | 97.3% |
| Interquartile 25% (IQ1) | 94.4% | 94.9% |
| Interquartile 75% (IQ3) | 98.9% | 99.5% |
| Interquartile Range (IQR) | 4.5% | 4.5% |
| Standard Deviation (Sample) | 3.4% | 4.5% |
| Standard Deviation (Population) | 3.4% | 4.5% |
Similar Demographics by 10th Grade
Demographics Similar to Celtics by 10th Grade
In terms of 10th grade, the demographic groups most similar to Celtics are Aleut (95.0%, a difference of 0.0%), Immigrants from Ireland (95.0%, a difference of 0.010%), New Zealander (95.0%, a difference of 0.010%), Ukrainian (95.0%, a difference of 0.010%), and Cypriot (95.0%, a difference of 0.010%).
| Demographics | Rating | Rank | 10th Grade |
| Ottawa | 99.8 /100 | #52 | Exceptional 95.1% |
| Immigrants | North America | 99.8 /100 | #53 | Exceptional 95.0% |
| Immigrants | Lithuania | 99.8 /100 | #54 | Exceptional 95.0% |
| Immigrants | Ireland | 99.8 /100 | #55 | Exceptional 95.0% |
| New Zealanders | 99.8 /100 | #56 | Exceptional 95.0% |
| Ukrainians | 99.8 /100 | #57 | Exceptional 95.0% |
| Aleuts | 99.8 /100 | #58 | Exceptional 95.0% |
| Celtics | 99.8 /100 | #59 | Exceptional 95.0% |
| Cypriots | 99.8 /100 | #60 | Exceptional 95.0% |
| Chippewa | 99.8 /100 | #61 | Exceptional 95.0% |
| Thais | 99.8 /100 | #62 | Exceptional 95.0% |
| Immigrants | Singapore | 99.8 /100 | #63 | Exceptional 95.0% |
| Native Hawaiians | 99.7 /100 | #64 | Exceptional 95.0% |
| Turks | 99.7 /100 | #65 | Exceptional 95.0% |
| Immigrants | Australia | 99.7 /100 | #66 | Exceptional 94.9% |
Demographics Similar to Immigrants from Japan by 10th Grade
In terms of 10th grade, the demographic groups most similar to Immigrants from Japan are Immigrants from Saudi Arabia (94.7%, a difference of 0.0%), Crow (94.7%, a difference of 0.010%), Puget Sound Salish (94.7%, a difference of 0.010%), Immigrants from Moldova (94.7%, a difference of 0.010%), and Icelander (94.7%, a difference of 0.020%).
| Demographics | Rating | Rank | 10th Grade |
| Immigrants | Latvia | 99.2 /100 | #81 | Exceptional 94.7% |
| Swiss | 99.1 /100 | #82 | Exceptional 94.7% |
| Immigrants | Western Europe | 99.1 /100 | #83 | Exceptional 94.7% |
| Icelanders | 99.1 /100 | #84 | Exceptional 94.7% |
| Crow | 99.0 /100 | #85 | Exceptional 94.7% |
| Puget Sound Salish | 99.0 /100 | #86 | Exceptional 94.7% |
| Immigrants | Saudi Arabia | 99.0 /100 | #87 | Exceptional 94.7% |
| Immigrants | Japan | 99.0 /100 | #88 | Exceptional 94.7% |
| Immigrants | Moldova | 98.9 /100 | #89 | Exceptional 94.7% |
| South Africans | 98.8 /100 | #90 | Exceptional 94.7% |
| Whites/Caucasians | 98.8 /100 | #91 | Exceptional 94.7% |
| Yugoslavians | 98.4 /100 | #92 | Exceptional 94.6% |
| Soviet Union | 98.3 /100 | #93 | Exceptional 94.6% |
| Immigrants | Germany | 98.3 /100 | #94 | Exceptional 94.6% |
| Menominee | 98.3 /100 | #95 | Exceptional 94.6% |