Carpatho Rusyn vs Albanian Poverty
COMPARE
Carpatho Rusyn
Albanian
Poverty
Poverty Comparison
Carpatho Rusyns
Albanians
11.3%
POVERTY
97.2/ 100
METRIC RATING
74th/ 347
METRIC RANK
11.7%
POVERTY
90.3/ 100
METRIC RATING
115th/ 347
METRIC RANK
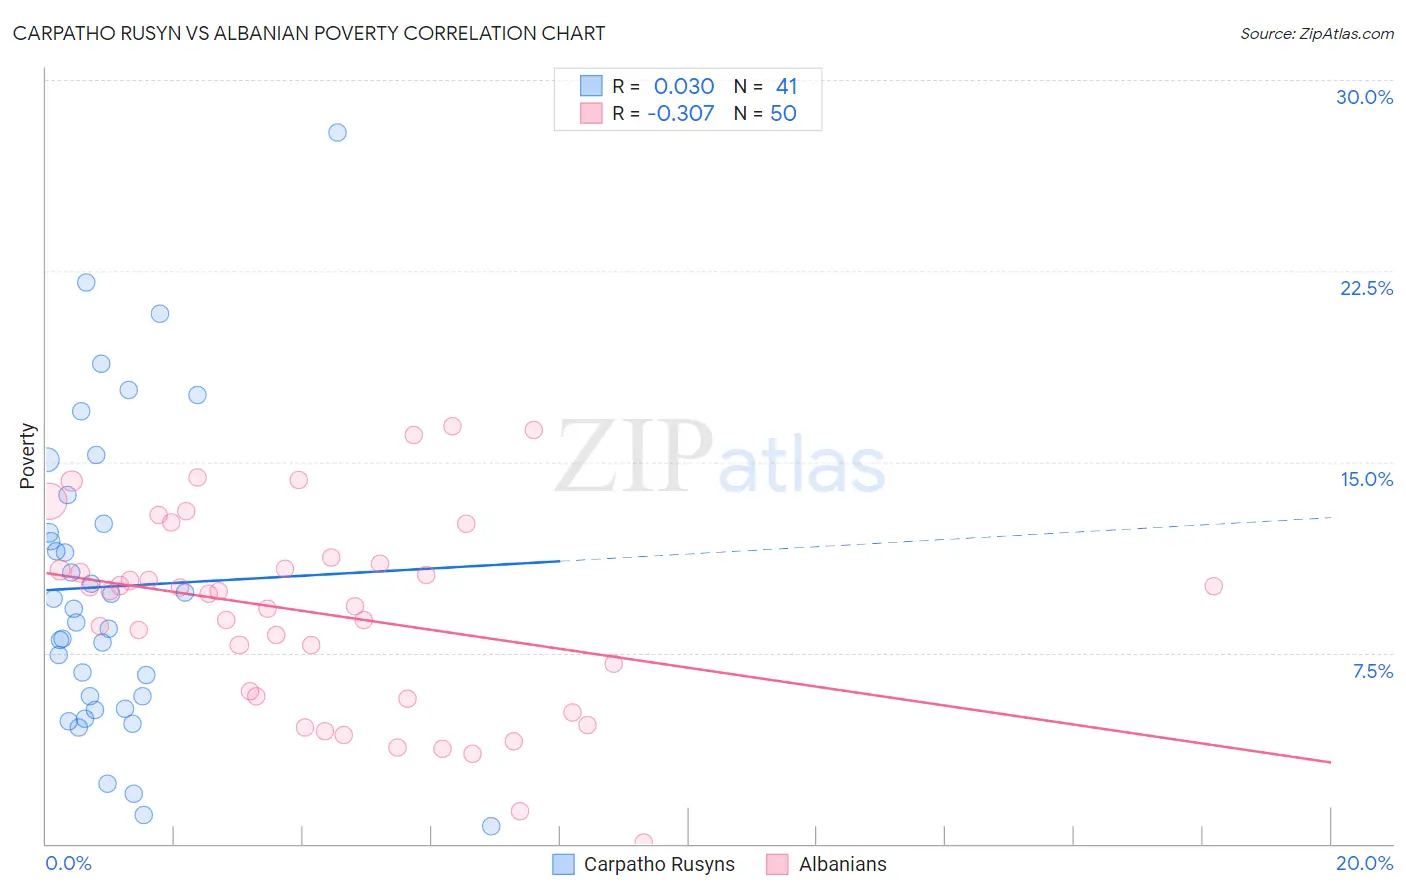
Carpatho Rusyn vs Albanian Poverty Correlation Chart
The statistical analysis conducted on geographies consisting of 58,869,628 people shows no correlation between the proportion of Carpatho Rusyns and poverty level in the United States with a correlation coefficient (R) of 0.030 and weighted average of 11.3%. Similarly, the statistical analysis conducted on geographies consisting of 193,180,317 people shows a mild negative correlation between the proportion of Albanians and poverty level in the United States with a correlation coefficient (R) of -0.307 and weighted average of 11.7%, a difference of 3.5%.
Poverty Correlation Summary
| Measurement | Carpatho Rusyn | Albanian |
| Minimum | 0.68% | 0.071% |
| Maximum | 27.9% | 16.4% |
| Range | 27.2% | 16.3% |
| Mean | 10.1% | 9.1% |
| Median | 9.2% | 9.9% |
| Interquartile 25% (IQ1) | 5.6% | 5.8% |
| Interquartile 75% (IQ3) | 13.1% | 11.0% |
| Interquartile Range (IQR) | 7.6% | 5.2% |
| Standard Deviation (Sample) | 6.0% | 3.9% |
| Standard Deviation (Population) | 5.9% | 3.8% |
Similar Demographics by Poverty
Demographics Similar to Carpatho Rusyns by Poverty
In terms of poverty, the demographic groups most similar to Carpatho Rusyns are European (11.3%, a difference of 0.050%), Immigrants from Belgium (11.3%, a difference of 0.050%), Zimbabwean (11.3%, a difference of 0.070%), Immigrants from Canada (11.3%, a difference of 0.090%), and Serbian (11.2%, a difference of 0.18%).
| Demographics | Rating | Rank | Poverty |
| Immigrants | Australia | 97.4 /100 | #67 | Exceptional 11.2% |
| Slovaks | 97.4 /100 | #68 | Exceptional 11.2% |
| Serbians | 97.4 /100 | #69 | Exceptional 11.2% |
| Immigrants | Canada | 97.3 /100 | #70 | Exceptional 11.3% |
| Zimbabweans | 97.3 /100 | #71 | Exceptional 11.3% |
| Europeans | 97.2 /100 | #72 | Exceptional 11.3% |
| Immigrants | Belgium | 97.2 /100 | #73 | Exceptional 11.3% |
| Carpatho Rusyns | 97.2 /100 | #74 | Exceptional 11.3% |
| Immigrants | Eastern Europe | 97.0 /100 | #75 | Exceptional 11.3% |
| Immigrants | North America | 96.8 /100 | #76 | Exceptional 11.3% |
| Immigrants | Eastern Asia | 96.7 /100 | #77 | Exceptional 11.3% |
| Dutch | 96.7 /100 | #78 | Exceptional 11.3% |
| Cambodians | 96.7 /100 | #79 | Exceptional 11.3% |
| Indians (Asian) | 96.6 /100 | #80 | Exceptional 11.3% |
| Irish | 96.6 /100 | #81 | Exceptional 11.3% |
Demographics Similar to Albanians by Poverty
In terms of poverty, the demographic groups most similar to Albanians are Immigrants from China (11.6%, a difference of 0.14%), Immigrants from Southern Europe (11.6%, a difference of 0.16%), Immigrants from Belarus (11.6%, a difference of 0.16%), Immigrants from Russia (11.7%, a difference of 0.17%), and French Canadian (11.6%, a difference of 0.23%).
| Demographics | Rating | Rank | Poverty |
| Canadians | 91.7 /100 | #108 | Exceptional 11.6% |
| Immigrants | Turkey | 91.7 /100 | #109 | Exceptional 11.6% |
| Welsh | 91.6 /100 | #110 | Exceptional 11.6% |
| French Canadians | 91.0 /100 | #111 | Exceptional 11.6% |
| Immigrants | Southern Europe | 90.8 /100 | #112 | Exceptional 11.6% |
| Immigrants | Belarus | 90.8 /100 | #113 | Exceptional 11.6% |
| Immigrants | China | 90.7 /100 | #114 | Exceptional 11.6% |
| Albanians | 90.3 /100 | #115 | Exceptional 11.7% |
| Immigrants | Russia | 89.7 /100 | #116 | Excellent 11.7% |
| Sri Lankans | 89.4 /100 | #117 | Excellent 11.7% |
| Argentineans | 89.1 /100 | #118 | Excellent 11.7% |
| Tlingit-Haida | 89.0 /100 | #119 | Excellent 11.7% |
| Immigrants | South Eastern Asia | 88.9 /100 | #120 | Excellent 11.7% |
| New Zealanders | 88.7 /100 | #121 | Excellent 11.7% |
| Puget Sound Salish | 88.7 /100 | #122 | Excellent 11.7% |