Carpatho Rusyn vs Black/African American Poverty
COMPARE
Carpatho Rusyn
Black/African American
Poverty
Poverty Comparison
Carpatho Rusyns
Blacks/African Americans
11.3%
POVERTY
97.2/ 100
METRIC RATING
74th/ 347
METRIC RANK
17.3%
POVERTY
0.0/ 100
METRIC RATING
329th/ 347
METRIC RANK
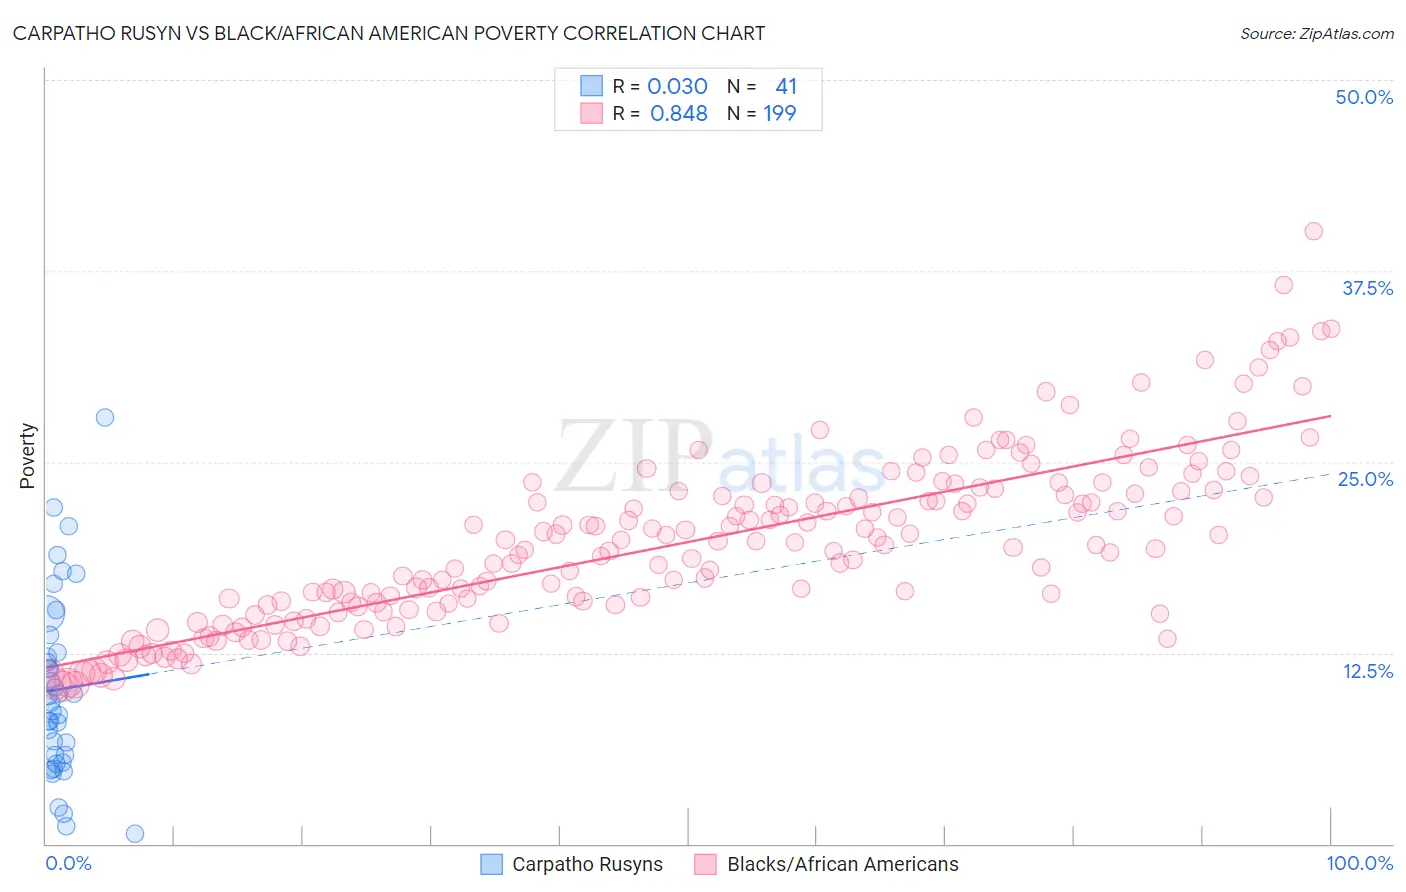
Carpatho Rusyn vs Black/African American Poverty Correlation Chart
The statistical analysis conducted on geographies consisting of 58,869,628 people shows no correlation between the proportion of Carpatho Rusyns and poverty level in the United States with a correlation coefficient (R) of 0.030 and weighted average of 11.3%. Similarly, the statistical analysis conducted on geographies consisting of 565,229,178 people shows a very strong positive correlation between the proportion of Blacks/African Americans and poverty level in the United States with a correlation coefficient (R) of 0.848 and weighted average of 17.3%, a difference of 53.2%.
Poverty Correlation Summary
| Measurement | Carpatho Rusyn | Black/African American |
| Minimum | 0.68% | 10.3% |
| Maximum | 27.9% | 40.1% |
| Range | 27.2% | 29.8% |
| Mean | 10.1% | 19.7% |
| Median | 9.2% | 19.6% |
| Interquartile 25% (IQ1) | 5.6% | 15.7% |
| Interquartile 75% (IQ3) | 13.1% | 23.1% |
| Interquartile Range (IQR) | 7.6% | 7.4% |
| Standard Deviation (Sample) | 6.0% | 5.6% |
| Standard Deviation (Population) | 5.9% | 5.6% |
Similar Demographics by Poverty
Demographics Similar to Carpatho Rusyns by Poverty
In terms of poverty, the demographic groups most similar to Carpatho Rusyns are European (11.3%, a difference of 0.050%), Immigrants from Belgium (11.3%, a difference of 0.050%), Zimbabwean (11.3%, a difference of 0.070%), Immigrants from Canada (11.3%, a difference of 0.090%), and Serbian (11.2%, a difference of 0.18%).
| Demographics | Rating | Rank | Poverty |
| Immigrants | Australia | 97.4 /100 | #67 | Exceptional 11.2% |
| Slovaks | 97.4 /100 | #68 | Exceptional 11.2% |
| Serbians | 97.4 /100 | #69 | Exceptional 11.2% |
| Immigrants | Canada | 97.3 /100 | #70 | Exceptional 11.3% |
| Zimbabweans | 97.3 /100 | #71 | Exceptional 11.3% |
| Europeans | 97.2 /100 | #72 | Exceptional 11.3% |
| Immigrants | Belgium | 97.2 /100 | #73 | Exceptional 11.3% |
| Carpatho Rusyns | 97.2 /100 | #74 | Exceptional 11.3% |
| Immigrants | Eastern Europe | 97.0 /100 | #75 | Exceptional 11.3% |
| Immigrants | North America | 96.8 /100 | #76 | Exceptional 11.3% |
| Immigrants | Eastern Asia | 96.7 /100 | #77 | Exceptional 11.3% |
| Dutch | 96.7 /100 | #78 | Exceptional 11.3% |
| Cambodians | 96.7 /100 | #79 | Exceptional 11.3% |
| Indians (Asian) | 96.6 /100 | #80 | Exceptional 11.3% |
| Irish | 96.6 /100 | #81 | Exceptional 11.3% |
Demographics Similar to Blacks/African Americans by Poverty
In terms of poverty, the demographic groups most similar to Blacks/African Americans are Ute (16.9%, a difference of 2.0%), Dominican (17.6%, a difference of 2.3%), Kiowa (16.8%, a difference of 2.5%), Paiute (16.7%, a difference of 3.0%), and Immigrants from Dominican Republic (17.8%, a difference of 3.2%).
| Demographics | Rating | Rank | Poverty |
| Menominee | 0.0 /100 | #322 | Tragic 16.4% |
| Colville | 0.0 /100 | #323 | Tragic 16.6% |
| Yakama | 0.0 /100 | #324 | Tragic 16.7% |
| Central American Indians | 0.0 /100 | #325 | Tragic 16.7% |
| Paiute | 0.0 /100 | #326 | Tragic 16.7% |
| Kiowa | 0.0 /100 | #327 | Tragic 16.8% |
| Ute | 0.0 /100 | #328 | Tragic 16.9% |
| Blacks/African Americans | 0.0 /100 | #329 | Tragic 17.3% |
| Dominicans | 0.0 /100 | #330 | Tragic 17.6% |
| Immigrants | Dominican Republic | 0.0 /100 | #331 | Tragic 17.8% |
| Natives/Alaskans | 0.0 /100 | #332 | Tragic 18.1% |
| Houma | 0.0 /100 | #333 | Tragic 18.4% |
| Apache | 0.0 /100 | #334 | Tragic 18.4% |
| Cheyenne | 0.0 /100 | #335 | Tragic 18.9% |
| Pueblo | 0.0 /100 | #336 | Tragic 19.4% |