Carpatho Rusyn vs Vietnamese Poverty
COMPARE
Carpatho Rusyn
Vietnamese
Poverty
Poverty Comparison
Carpatho Rusyns
Vietnamese
11.3%
POVERTY
97.2/ 100
METRIC RATING
74th/ 347
METRIC RANK
15.0%
POVERTY
0.0/ 100
METRIC RATING
285th/ 347
METRIC RANK
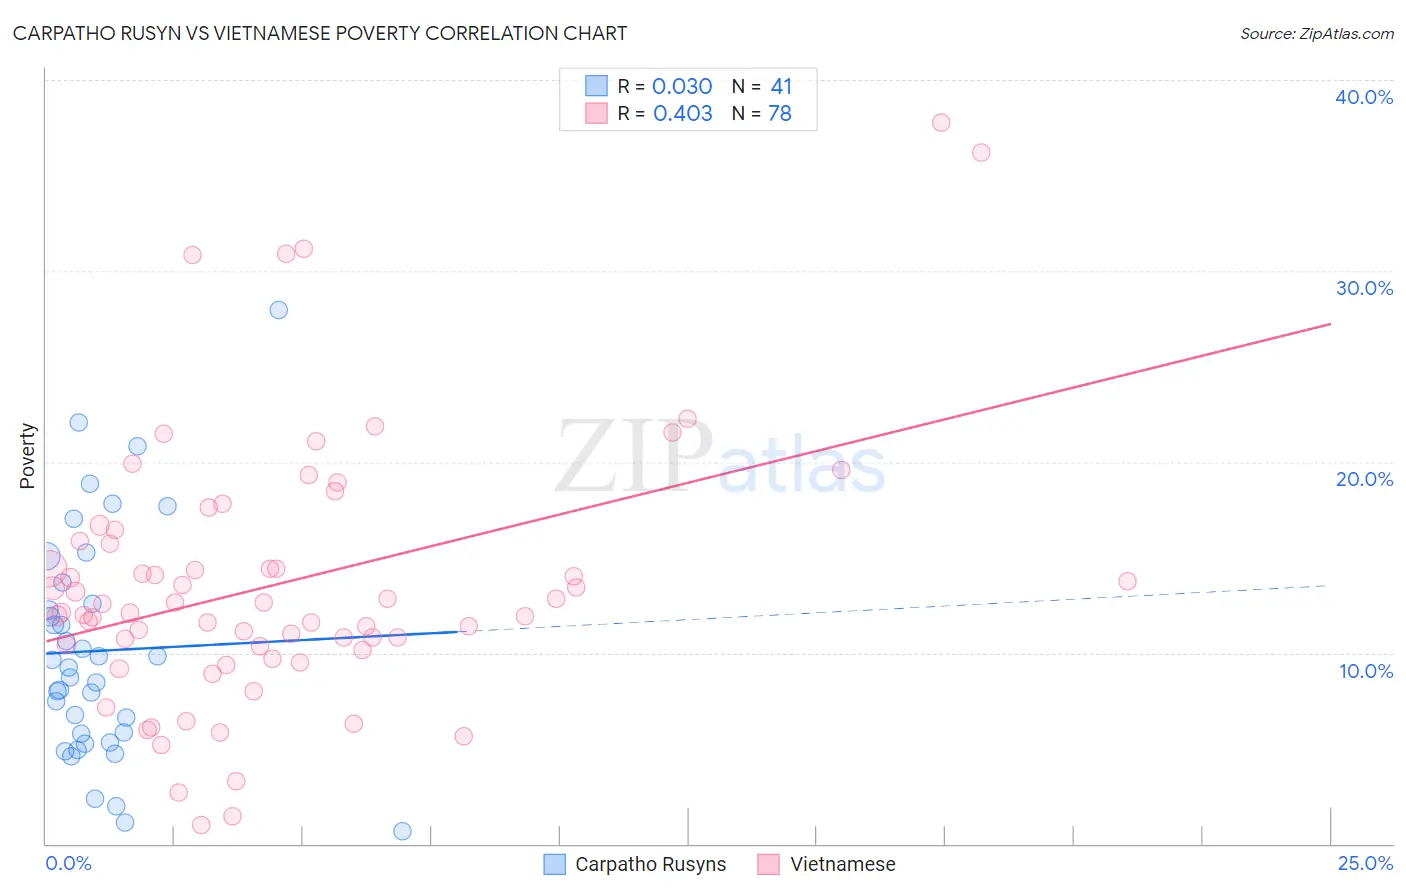
Carpatho Rusyn vs Vietnamese Poverty Correlation Chart
The statistical analysis conducted on geographies consisting of 58,869,628 people shows no correlation between the proportion of Carpatho Rusyns and poverty level in the United States with a correlation coefficient (R) of 0.030 and weighted average of 11.3%. Similarly, the statistical analysis conducted on geographies consisting of 170,677,568 people shows a moderate positive correlation between the proportion of Vietnamese and poverty level in the United States with a correlation coefficient (R) of 0.403 and weighted average of 15.0%, a difference of 33.2%.
Poverty Correlation Summary
| Measurement | Carpatho Rusyn | Vietnamese |
| Minimum | 0.68% | 1.0% |
| Maximum | 27.9% | 37.7% |
| Range | 27.2% | 36.7% |
| Mean | 10.1% | 13.6% |
| Median | 9.2% | 12.3% |
| Interquartile 25% (IQ1) | 5.6% | 10.4% |
| Interquartile 75% (IQ3) | 13.1% | 15.9% |
| Interquartile Range (IQR) | 7.6% | 5.5% |
| Standard Deviation (Sample) | 6.0% | 7.0% |
| Standard Deviation (Population) | 5.9% | 7.0% |
Similar Demographics by Poverty
Demographics Similar to Carpatho Rusyns by Poverty
In terms of poverty, the demographic groups most similar to Carpatho Rusyns are European (11.3%, a difference of 0.050%), Immigrants from Belgium (11.3%, a difference of 0.050%), Zimbabwean (11.3%, a difference of 0.070%), Immigrants from Canada (11.3%, a difference of 0.090%), and Serbian (11.2%, a difference of 0.18%).
| Demographics | Rating | Rank | Poverty |
| Immigrants | Australia | 97.4 /100 | #67 | Exceptional 11.2% |
| Slovaks | 97.4 /100 | #68 | Exceptional 11.2% |
| Serbians | 97.4 /100 | #69 | Exceptional 11.2% |
| Immigrants | Canada | 97.3 /100 | #70 | Exceptional 11.3% |
| Zimbabweans | 97.3 /100 | #71 | Exceptional 11.3% |
| Europeans | 97.2 /100 | #72 | Exceptional 11.3% |
| Immigrants | Belgium | 97.2 /100 | #73 | Exceptional 11.3% |
| Carpatho Rusyns | 97.2 /100 | #74 | Exceptional 11.3% |
| Immigrants | Eastern Europe | 97.0 /100 | #75 | Exceptional 11.3% |
| Immigrants | North America | 96.8 /100 | #76 | Exceptional 11.3% |
| Immigrants | Eastern Asia | 96.7 /100 | #77 | Exceptional 11.3% |
| Dutch | 96.7 /100 | #78 | Exceptional 11.3% |
| Cambodians | 96.7 /100 | #79 | Exceptional 11.3% |
| Indians (Asian) | 96.6 /100 | #80 | Exceptional 11.3% |
| Irish | 96.6 /100 | #81 | Exceptional 11.3% |
Demographics Similar to Vietnamese by Poverty
In terms of poverty, the demographic groups most similar to Vietnamese are West Indian (15.0%, a difference of 0.050%), Immigrants from Haiti (15.0%, a difference of 0.16%), Immigrants from Latin America (15.0%, a difference of 0.26%), Comanche (15.0%, a difference of 0.28%), and Inupiat (15.1%, a difference of 0.47%).
| Demographics | Rating | Rank | Poverty |
| Belizeans | 0.0 /100 | #278 | Tragic 14.8% |
| Immigrants | St. Vincent and the Grenadines | 0.0 /100 | #279 | Tragic 14.9% |
| Haitians | 0.0 /100 | #280 | Tragic 14.9% |
| Immigrants | Barbados | 0.0 /100 | #281 | Tragic 14.9% |
| Comanche | 0.0 /100 | #282 | Tragic 15.0% |
| Immigrants | Haiti | 0.0 /100 | #283 | Tragic 15.0% |
| West Indians | 0.0 /100 | #284 | Tragic 15.0% |
| Vietnamese | 0.0 /100 | #285 | Tragic 15.0% |
| Immigrants | Latin America | 0.0 /100 | #286 | Tragic 15.0% |
| Inupiat | 0.0 /100 | #287 | Tragic 15.1% |
| Yaqui | 0.0 /100 | #288 | Tragic 15.1% |
| Immigrants | Belize | 0.0 /100 | #289 | Tragic 15.1% |
| Mexicans | 0.0 /100 | #290 | Tragic 15.1% |
| Immigrants | Cabo Verde | 0.0 /100 | #291 | Tragic 15.1% |
| Indonesians | 0.0 /100 | #292 | Tragic 15.1% |