Carpatho Rusyn vs Jordanian Median Earnings
COMPARE
Carpatho Rusyn
Jordanian
Median Earnings
Median Earnings Comparison
Carpatho Rusyns
Jordanians
$48,617
MEDIAN EARNINGS
95.5/ 100
METRIC RATING
120th/ 347
METRIC RANK
$49,632
MEDIAN EARNINGS
98.9/ 100
METRIC RATING
101st/ 347
METRIC RANK
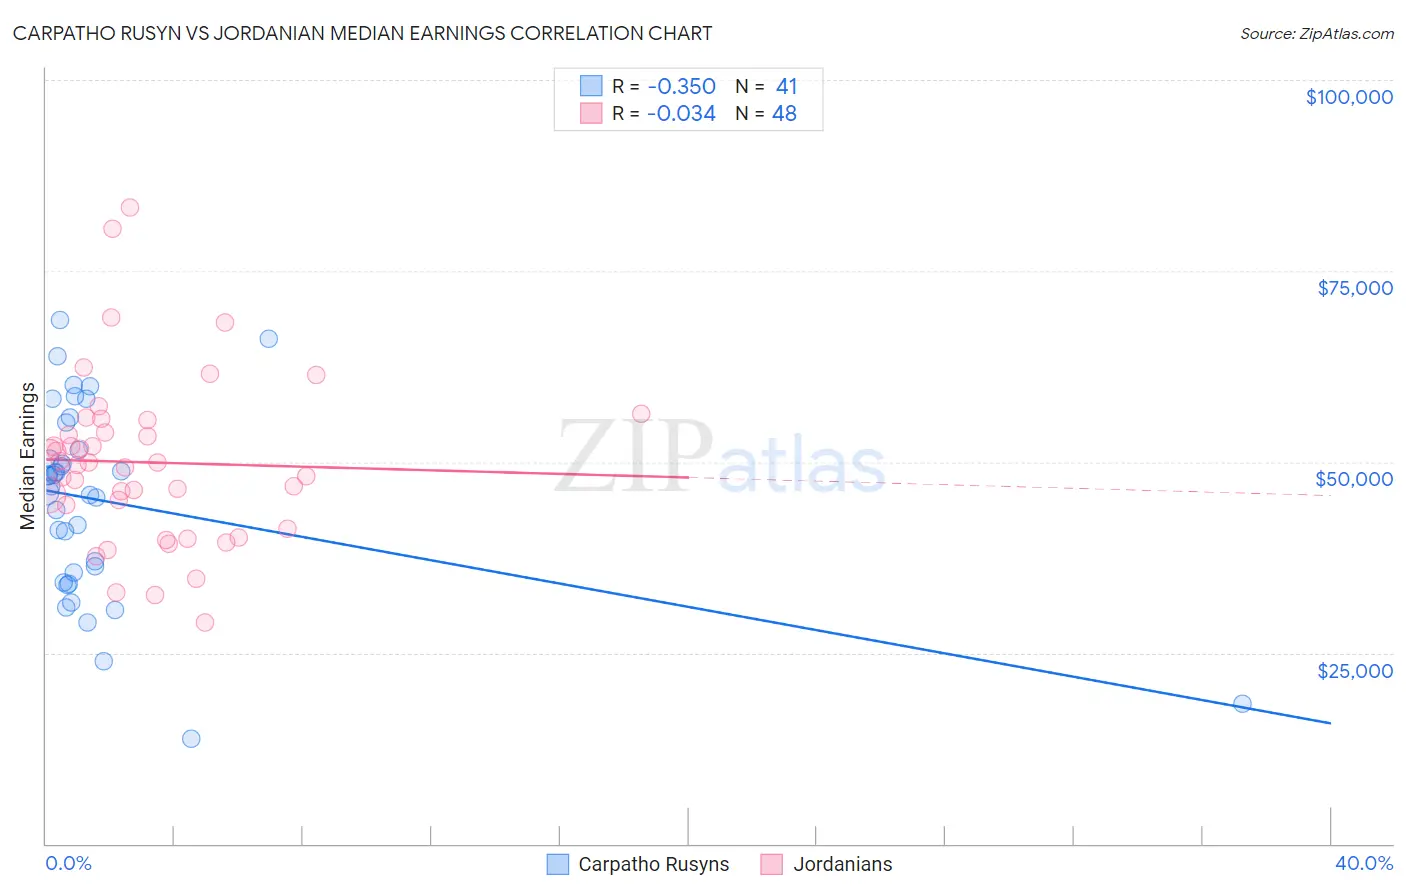
Carpatho Rusyn vs Jordanian Median Earnings Correlation Chart
The statistical analysis conducted on geographies consisting of 58,866,831 people shows a mild negative correlation between the proportion of Carpatho Rusyns and median earnings in the United States with a correlation coefficient (R) of -0.350 and weighted average of $48,617. Similarly, the statistical analysis conducted on geographies consisting of 166,400,944 people shows no correlation between the proportion of Jordanians and median earnings in the United States with a correlation coefficient (R) of -0.034 and weighted average of $49,632, a difference of 2.1%.
Median Earnings Correlation Summary
| Measurement | Carpatho Rusyn | Jordanian |
| Minimum | $13,750 | $29,018 |
| Maximum | $68,541 | $83,283 |
| Range | $54,791 | $54,265 |
| Mean | $44,793 | $49,942 |
| Median | $46,820 | $49,819 |
| Interquartile 25% (IQ1) | $34,839 | $42,798 |
| Interquartile 75% (IQ3) | $53,317 | $54,622 |
| Interquartile Range (IQR) | $18,479 | $11,824 |
| Standard Deviation (Sample) | $12,606 | $11,002 |
| Standard Deviation (Population) | $12,452 | $10,887 |
Demographics Similar to Carpatho Rusyns and Jordanians by Median Earnings
In terms of median earnings, the demographic groups most similar to Carpatho Rusyns are Polish ($48,659, a difference of 0.080%), Immigrants from Jordan ($48,673, a difference of 0.11%), Serbian ($48,677, a difference of 0.12%), Korean ($48,727, a difference of 0.23%), and Moroccan ($48,838, a difference of 0.45%). Similarly, the demographic groups most similar to Jordanians are Immigrants from Poland ($49,633, a difference of 0.0%), Ethiopian ($49,572, a difference of 0.12%), Austrian ($49,501, a difference of 0.27%), Immigrants from Brazil ($49,463, a difference of 0.34%), and Immigrants from Western Asia ($49,389, a difference of 0.49%).
| Demographics | Rating | Rank | Median Earnings |
| Immigrants | Poland | 98.9 /100 | #100 | Exceptional $49,633 |
| Jordanians | 98.9 /100 | #101 | Exceptional $49,632 |
| Ethiopians | 98.8 /100 | #102 | Exceptional $49,572 |
| Austrians | 98.7 /100 | #103 | Exceptional $49,501 |
| Immigrants | Brazil | 98.6 /100 | #104 | Exceptional $49,463 |
| Immigrants | Western Asia | 98.4 /100 | #105 | Exceptional $49,389 |
| Immigrants | Albania | 98.4 /100 | #106 | Exceptional $49,377 |
| Immigrants | Morocco | 98.4 /100 | #107 | Exceptional $49,368 |
| Palestinians | 98.0 /100 | #108 | Exceptional $49,209 |
| Syrians | 97.1 /100 | #109 | Exceptional $48,934 |
| Immigrants | Ethiopia | 97.1 /100 | #110 | Exceptional $48,924 |
| Immigrants | Zimbabwe | 97.0 /100 | #111 | Exceptional $48,913 |
| Northern Europeans | 96.9 /100 | #112 | Exceptional $48,887 |
| Immigrants | Kuwait | 96.8 /100 | #113 | Exceptional $48,861 |
| Moroccans | 96.7 /100 | #114 | Exceptional $48,838 |
| Chinese | 96.7 /100 | #115 | Exceptional $48,836 |
| Koreans | 96.2 /100 | #116 | Exceptional $48,727 |
| Serbians | 95.9 /100 | #117 | Exceptional $48,677 |
| Immigrants | Jordan | 95.9 /100 | #118 | Exceptional $48,673 |
| Poles | 95.8 /100 | #119 | Exceptional $48,659 |
| Carpatho Rusyns | 95.5 /100 | #120 | Exceptional $48,617 |