Carpatho Rusyn vs Immigrants from Eastern Africa Female Poverty Among 25-34 Year Olds
COMPARE
Carpatho Rusyn
Immigrants from Eastern Africa
Female Poverty Among 25-34 Year Olds
Female Poverty Among 25-34 Year Olds Comparison
Carpatho Rusyns
Immigrants from Eastern Africa
12.8%
FEMALE POVERTY AMONG 25-34 YEAR OLDS
93.0/ 100
METRIC RATING
120th/ 347
METRIC RANK
13.6%
FEMALE POVERTY AMONG 25-34 YEAR OLDS
43.6/ 100
METRIC RATING
179th/ 347
METRIC RANK
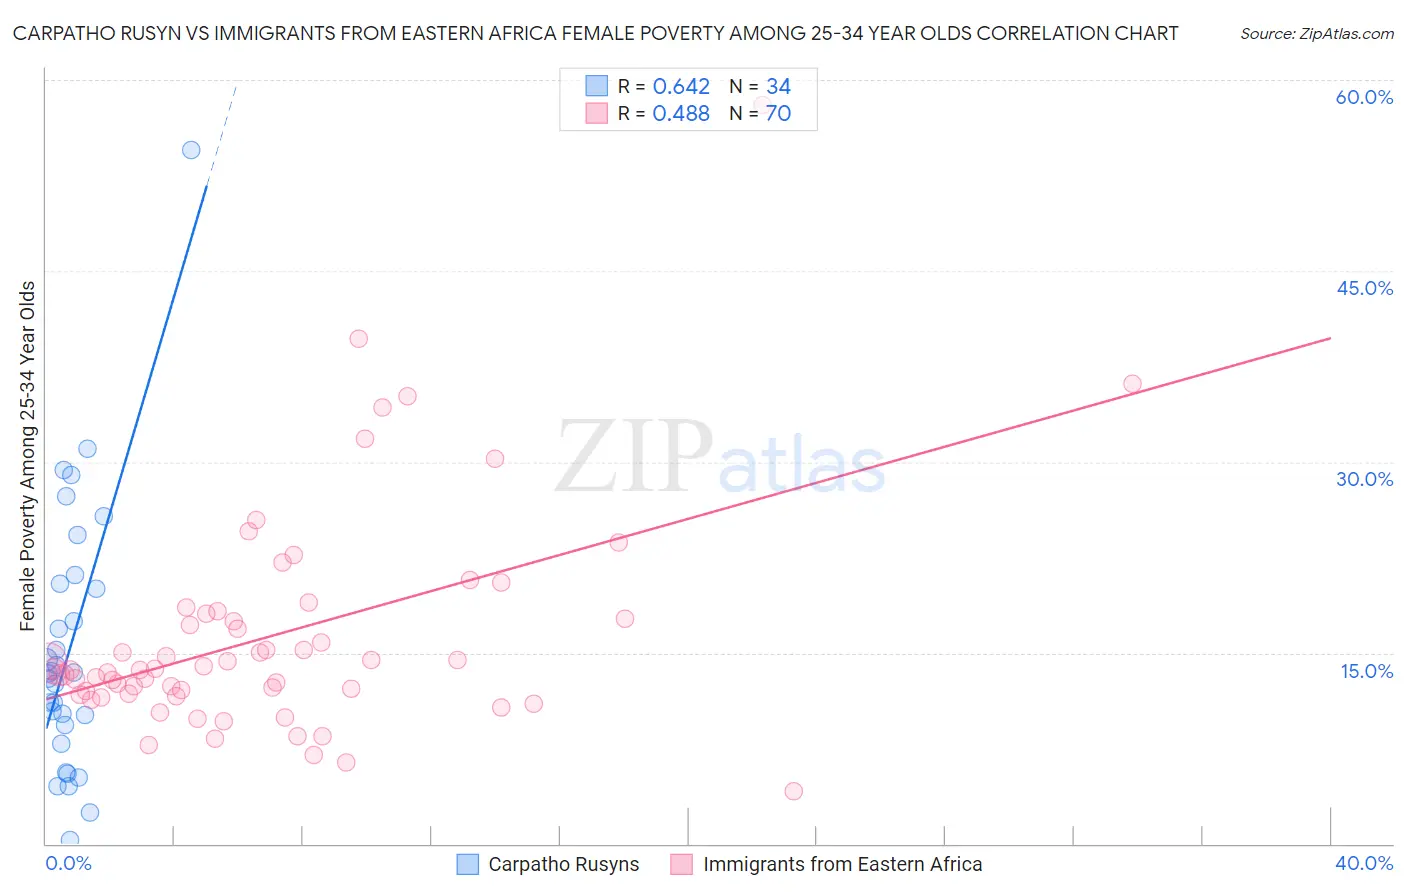
Carpatho Rusyn vs Immigrants from Eastern Africa Female Poverty Among 25-34 Year Olds Correlation Chart
The statistical analysis conducted on geographies consisting of 58,469,179 people shows a significant positive correlation between the proportion of Carpatho Rusyns and poverty level among females between the ages 25 and 34 in the United States with a correlation coefficient (R) of 0.642 and weighted average of 12.8%. Similarly, the statistical analysis conducted on geographies consisting of 350,717,935 people shows a moderate positive correlation between the proportion of Immigrants from Eastern Africa and poverty level among females between the ages 25 and 34 in the United States with a correlation coefficient (R) of 0.488 and weighted average of 13.6%, a difference of 6.2%.
Female Poverty Among 25-34 Year Olds Correlation Summary
| Measurement | Carpatho Rusyn | Immigrants from Eastern Africa |
| Minimum | 0.28% | 4.1% |
| Maximum | 54.5% | 58.1% |
| Range | 54.3% | 53.9% |
| Mean | 15.4% | 16.4% |
| Median | 13.4% | 13.7% |
| Interquartile 25% (IQ1) | 9.3% | 11.8% |
| Interquartile 75% (IQ3) | 20.4% | 18.1% |
| Interquartile Range (IQR) | 11.1% | 6.3% |
| Standard Deviation (Sample) | 10.6% | 8.8% |
| Standard Deviation (Population) | 10.5% | 8.7% |
Similar Demographics by Female Poverty Among 25-34 Year Olds
Demographics Similar to Carpatho Rusyns by Female Poverty Among 25-34 Year Olds
In terms of female poverty among 25-34 year olds, the demographic groups most similar to Carpatho Rusyns are Immigrants from Nepal (12.8%, a difference of 0.0%), Mongolian (12.8%, a difference of 0.010%), Immigrants from Kuwait (12.8%, a difference of 0.030%), Romanian (12.8%, a difference of 0.070%), and Immigrants from Western Asia (12.8%, a difference of 0.080%).
| Demographics | Rating | Rank | Female Poverty Among 25-34 Year Olds |
| Immigrants | Syria | 93.8 /100 | #113 | Exceptional 12.8% |
| Immigrants | Southern Europe | 93.6 /100 | #114 | Exceptional 12.8% |
| Immigrants | Brazil | 93.3 /100 | #115 | Exceptional 12.8% |
| Chileans | 93.2 /100 | #116 | Exceptional 12.8% |
| Immigrants | Kuwait | 93.1 /100 | #117 | Exceptional 12.8% |
| Mongolians | 93.0 /100 | #118 | Exceptional 12.8% |
| Immigrants | Nepal | 93.0 /100 | #119 | Exceptional 12.8% |
| Carpatho Rusyns | 93.0 /100 | #120 | Exceptional 12.8% |
| Romanians | 92.8 /100 | #121 | Exceptional 12.8% |
| Immigrants | Western Asia | 92.7 /100 | #122 | Exceptional 12.8% |
| Slovenes | 92.7 /100 | #123 | Exceptional 12.8% |
| Immigrants | Netherlands | 92.0 /100 | #124 | Exceptional 12.8% |
| Immigrants | Canada | 91.5 /100 | #125 | Exceptional 12.9% |
| Immigrants | Fiji | 91.2 /100 | #126 | Exceptional 12.9% |
| Czechs | 90.3 /100 | #127 | Exceptional 12.9% |
Demographics Similar to Immigrants from Eastern Africa by Female Poverty Among 25-34 Year Olds
In terms of female poverty among 25-34 year olds, the demographic groups most similar to Immigrants from Eastern Africa are Canadian (13.6%, a difference of 0.060%), Venezuelan (13.6%, a difference of 0.090%), Yugoslavian (13.6%, a difference of 0.12%), German (13.6%, a difference of 0.17%), and Guamanian/Chamorro (13.6%, a difference of 0.17%).
| Demographics | Rating | Rank | Female Poverty Among 25-34 Year Olds |
| Immigrants | Costa Rica | 51.9 /100 | #172 | Average 13.5% |
| Kenyans | 51.8 /100 | #173 | Average 13.5% |
| Immigrants | Oceania | 50.0 /100 | #174 | Average 13.5% |
| Bermudans | 46.8 /100 | #175 | Average 13.6% |
| Yugoslavians | 45.0 /100 | #176 | Average 13.6% |
| Venezuelans | 44.6 /100 | #177 | Average 13.6% |
| Canadians | 44.3 /100 | #178 | Average 13.6% |
| Immigrants | Eastern Africa | 43.6 /100 | #179 | Average 13.6% |
| Germans | 41.6 /100 | #180 | Average 13.6% |
| Guamanians/Chamorros | 41.5 /100 | #181 | Average 13.6% |
| Immigrants | Venezuela | 40.7 /100 | #182 | Average 13.6% |
| Portuguese | 40.3 /100 | #183 | Average 13.6% |
| Czechoslovakians | 36.8 /100 | #184 | Fair 13.7% |
| Irish | 35.3 /100 | #185 | Fair 13.7% |
| Immigrants | Uruguay | 34.1 /100 | #186 | Fair 13.7% |