Carpatho Rusyn vs Guyanese 11th Grade
COMPARE
Carpatho Rusyn
Guyanese
11th Grade
11th Grade Comparison
Carpatho Rusyns
Guyanese
94.8%
11TH GRADE
100.0/ 100
METRIC RATING
5th/ 347
METRIC RANK
89.9%
11TH GRADE
0.0/ 100
METRIC RATING
301st/ 347
METRIC RANK
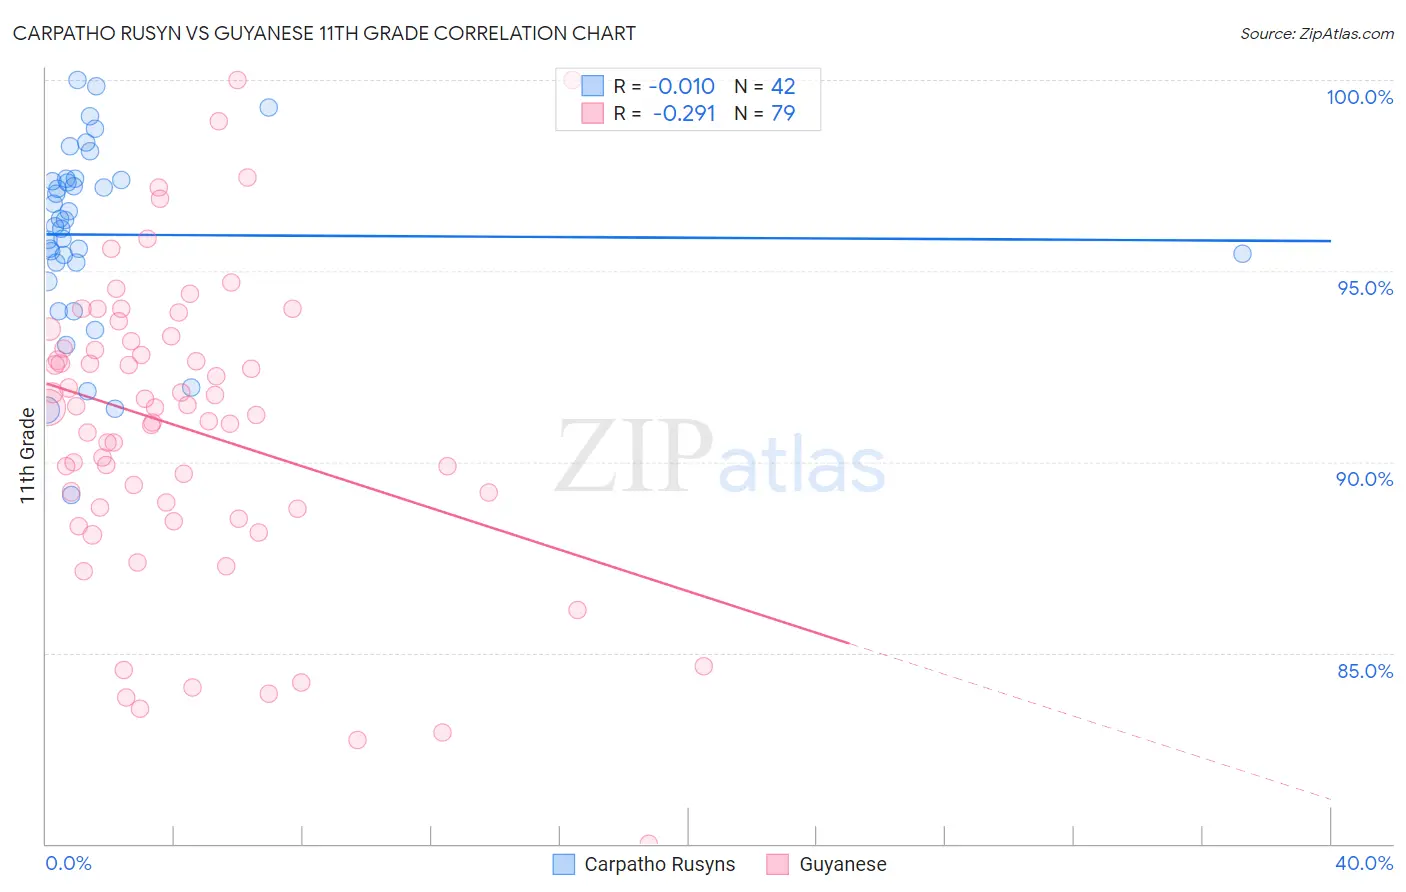
Carpatho Rusyn vs Guyanese 11th Grade Correlation Chart
The statistical analysis conducted on geographies consisting of 58,871,690 people shows no correlation between the proportion of Carpatho Rusyns and percentage of population with at least 11th grade education in the United States with a correlation coefficient (R) of -0.010 and weighted average of 94.8%. Similarly, the statistical analysis conducted on geographies consisting of 176,937,226 people shows a weak negative correlation between the proportion of Guyanese and percentage of population with at least 11th grade education in the United States with a correlation coefficient (R) of -0.291 and weighted average of 89.9%, a difference of 5.5%.
11th Grade Correlation Summary
| Measurement | Carpatho Rusyn | Guyanese |
| Minimum | 89.1% | 80.0% |
| Maximum | 100.0% | 100.0% |
| Range | 10.9% | 20.0% |
| Mean | 95.9% | 90.9% |
| Median | 96.3% | 91.4% |
| Interquartile 25% (IQ1) | 95.2% | 88.8% |
| Interquartile 75% (IQ3) | 97.4% | 93.2% |
| Interquartile Range (IQR) | 2.1% | 4.4% |
| Standard Deviation (Sample) | 2.4% | 4.0% |
| Standard Deviation (Population) | 2.4% | 4.0% |
Similar Demographics by 11th Grade
Demographics Similar to Carpatho Rusyns by 11th Grade
In terms of 11th grade, the demographic groups most similar to Carpatho Rusyns are Lithuanian (94.8%, a difference of 0.050%), Slovak (94.9%, a difference of 0.060%), Slovene (94.9%, a difference of 0.080%), Swedish (94.9%, a difference of 0.10%), and Polish (94.8%, a difference of 0.10%).
| Demographics | Rating | Rank | 11th Grade |
| Norwegians | 100.0 /100 | #1 | Exceptional 95.2% |
| Swedes | 100.0 /100 | #2 | Exceptional 94.9% |
| Slovenes | 100.0 /100 | #3 | Exceptional 94.9% |
| Slovaks | 100.0 /100 | #4 | Exceptional 94.9% |
| Carpatho Rusyns | 100.0 /100 | #5 | Exceptional 94.8% |
| Lithuanians | 100.0 /100 | #6 | Exceptional 94.8% |
| Poles | 100.0 /100 | #7 | Exceptional 94.8% |
| Croatians | 100.0 /100 | #8 | Exceptional 94.7% |
| Danes | 100.0 /100 | #9 | Exceptional 94.7% |
| Finns | 100.0 /100 | #10 | Exceptional 94.7% |
| Germans | 100.0 /100 | #11 | Exceptional 94.7% |
| Latvians | 100.0 /100 | #12 | Exceptional 94.7% |
| Chinese | 100.0 /100 | #13 | Exceptional 94.6% |
| Eastern Europeans | 100.0 /100 | #14 | Exceptional 94.6% |
| Bulgarians | 100.0 /100 | #15 | Exceptional 94.5% |
Demographics Similar to Guyanese by 11th Grade
In terms of 11th grade, the demographic groups most similar to Guyanese are Immigrants from Haiti (89.9%, a difference of 0.010%), Japanese (89.9%, a difference of 0.020%), Immigrants from Fiji (89.9%, a difference of 0.050%), Navajo (90.0%, a difference of 0.12%), and Fijian (90.0%, a difference of 0.16%).
| Demographics | Rating | Rank | 11th Grade |
| Immigrants | Grenada | 0.0 /100 | #294 | Tragic 90.1% |
| Immigrants | Vietnam | 0.0 /100 | #295 | Tragic 90.0% |
| Fijians | 0.0 /100 | #296 | Tragic 90.0% |
| Navajo | 0.0 /100 | #297 | Tragic 90.0% |
| Immigrants | Fiji | 0.0 /100 | #298 | Tragic 89.9% |
| Japanese | 0.0 /100 | #299 | Tragic 89.9% |
| Immigrants | Haiti | 0.0 /100 | #300 | Tragic 89.9% |
| Guyanese | 0.0 /100 | #301 | Tragic 89.9% |
| Immigrants | Guyana | 0.0 /100 | #302 | Tragic 89.7% |
| Immigrants | Immigrants | 0.0 /100 | #303 | Tragic 89.7% |
| Yuman | 0.0 /100 | #304 | Tragic 89.7% |
| Immigrants | Cambodia | 0.0 /100 | #305 | Tragic 89.6% |
| Ecuadorians | 0.0 /100 | #306 | Tragic 89.6% |
| Immigrants | Dominica | 0.0 /100 | #307 | Tragic 89.5% |
| Nepalese | 0.0 /100 | #308 | Tragic 89.5% |