Carpatho Rusyn vs Guyanese Single Father Households
COMPARE
Carpatho Rusyn
Guyanese
Single Father Households
Single Father Households Comparison
Carpatho Rusyns
Guyanese
2.1%
SINGLE FATHER HOUSEHOLDS
99.6/ 100
METRIC RATING
84th/ 347
METRIC RANK
2.1%
SINGLE FATHER HOUSEHOLDS
99.1/ 100
METRIC RATING
98th/ 347
METRIC RANK
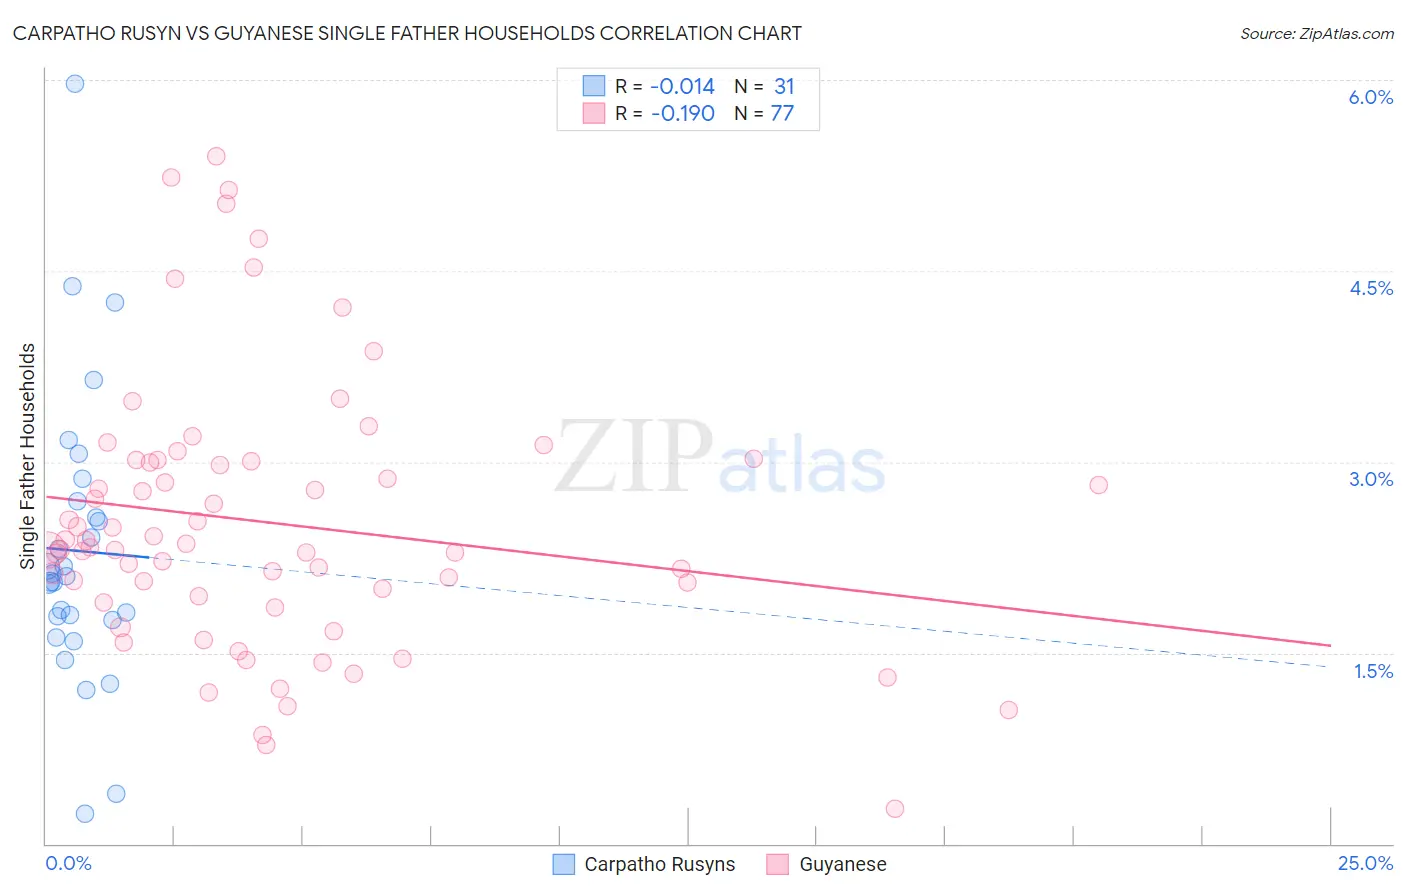
Carpatho Rusyn vs Guyanese Single Father Households Correlation Chart
The statistical analysis conducted on geographies consisting of 58,690,125 people shows no correlation between the proportion of Carpatho Rusyns and percentage of single father households in the United States with a correlation coefficient (R) of -0.014 and weighted average of 2.1%. Similarly, the statistical analysis conducted on geographies consisting of 176,087,716 people shows a poor negative correlation between the proportion of Guyanese and percentage of single father households in the United States with a correlation coefficient (R) of -0.190 and weighted average of 2.1%, a difference of 1.9%.
Single Father Households Correlation Summary
| Measurement | Carpatho Rusyn | Guyanese |
| Minimum | 0.23% | 0.28% |
| Maximum | 6.0% | 5.4% |
| Range | 5.7% | 5.1% |
| Mean | 2.3% | 2.5% |
| Median | 2.1% | 2.3% |
| Interquartile 25% (IQ1) | 1.8% | 1.9% |
| Interquartile 75% (IQ3) | 2.7% | 3.0% |
| Interquartile Range (IQR) | 0.93% | 1.1% |
| Standard Deviation (Sample) | 1.1% | 1.1% |
| Standard Deviation (Population) | 1.1% | 1.0% |
Demographics Similar to Carpatho Rusyns and Guyanese by Single Father Households
In terms of single father households, the demographic groups most similar to Carpatho Rusyns are Immigrants from Hungary (2.1%, a difference of 0.040%), Asian (2.1%, a difference of 0.12%), Greek (2.1%, a difference of 0.30%), New Zealander (2.1%, a difference of 0.31%), and Armenian (2.1%, a difference of 0.36%). Similarly, the demographic groups most similar to Guyanese are South African (2.1%, a difference of 0.040%), Immigrants from Moldova (2.1%, a difference of 0.13%), Immigrants from Northern Africa (2.1%, a difference of 0.19%), Arab (2.1%, a difference of 0.25%), and Immigrants from Western Europe (2.1%, a difference of 0.34%).
| Demographics | Rating | Rank | Single Father Households |
| Armenians | 99.7 /100 | #81 | Exceptional 2.1% |
| New Zealanders | 99.7 /100 | #82 | Exceptional 2.1% |
| Greeks | 99.7 /100 | #83 | Exceptional 2.1% |
| Carpatho Rusyns | 99.6 /100 | #84 | Exceptional 2.1% |
| Immigrants | Hungary | 99.6 /100 | #85 | Exceptional 2.1% |
| Asians | 99.6 /100 | #86 | Exceptional 2.1% |
| Lithuanians | 99.5 /100 | #87 | Exceptional 2.1% |
| Bhutanese | 99.5 /100 | #88 | Exceptional 2.1% |
| Immigrants | Armenia | 99.5 /100 | #89 | Exceptional 2.1% |
| Immigrants | Pakistan | 99.5 /100 | #90 | Exceptional 2.1% |
| Immigrants | Guyana | 99.4 /100 | #91 | Exceptional 2.1% |
| Romanians | 99.4 /100 | #92 | Exceptional 2.1% |
| Croatians | 99.3 /100 | #93 | Exceptional 2.1% |
| Ukrainians | 99.3 /100 | #94 | Exceptional 2.1% |
| Bermudans | 99.2 /100 | #95 | Exceptional 2.1% |
| Arabs | 99.2 /100 | #96 | Exceptional 2.1% |
| Immigrants | Moldova | 99.1 /100 | #97 | Exceptional 2.1% |
| Guyanese | 99.1 /100 | #98 | Exceptional 2.1% |
| South Africans | 99.1 /100 | #99 | Exceptional 2.1% |
| Immigrants | Northern Africa | 99.0 /100 | #100 | Exceptional 2.1% |
| Immigrants | Western Europe | 98.9 /100 | #101 | Exceptional 2.1% |