Cape Verdean vs European Child Poverty Among Girls Under 16

COMPARE

Cape Verdean
Race
Ancestry
AfghanAfricanAlaska NativeAlaskan AthabascanAlbanianAleutAlsatianAmericanApacheArabArapahoArgentineanArmenianAssyrian/Chaldean/SyriacAustralianAustrianBahamianBangladeshiBarbadianBasqueBelgianBelizeanBermudanBhutaneseBlackfeetBolivianBrazilianBritishBritish West IndianBulgarianBurmeseCajunCambodianCanadianCape VerdeanCarpatho RusynCelticCentral AmericanCentral American IndianCherokeeCheyenneChickasawChileanChineseChippewaChoctawColombianColvilleComancheCosta RicanCreeCreekCroatianCrowCubanCypriotCzechCzechoslovakianDanishDelawareDominicanDutchDutch West IndianEastern EuropeanEcuadorianEgyptianEnglishEstonianEthiopianFijianFilipinoFinnishFrenchFrench American IndianFrench CanadianGermanGerman RussianGhanaianGreekGuamanian/ChamorroGuatemalanGuyaneseHaitianHmongHonduranHopiHoumaHungarianIcelanderIndian (Asian)IndonesianInupiatIranianIraqiIrishIroquoisIsraeliItalianJamaicanJapaneseJordanianKenyanKiowaKoreanLaotianLatvianLebaneseLiberianLithuanianLumbeeLuxembourgerMacedonianMalaysianMalteseMarshalleseMenomineeMexicanMexican American IndianMongolianMoroccanNative HawaiianNavajoNepaleseNew ZealanderNicaraguanNigerianNorthern EuropeanNorwegianOkinawanOsageOttawaPaiutePakistaniPalestinianPanamanianParaguayanPennsylvania GermanPeruvianPimaPolishPortuguesePotawatomiPuebloPuerto RicanPuget Sound SalishRomanianRussianSalvadoranSamoanScandinavianScotch-IrishScottishSeminoleSenegaleseSerbianShoshoneSierra LeoneanSiouxSlavicSlovakSloveneSomaliSouth AfricanSouth AmericanSouth American IndianSoviet UnionSpaniardSpanishSpanish AmericanSpanish American IndianSri LankanSubsaharan AfricanSudaneseSwedishSwissSyrianTaiwaneseThaiTlingit-HaidaTohono O'OdhamTonganTrinidadian and TobagonianTsimshianTurkishU.S. Virgin IslanderUgandanUkrainianUruguayanUteVenezuelanVietnameseWelshWest IndianYakamaYaquiYugoslavianYumanYup'ikZimbabwean
Immigration
NonimmigrantsImmigrantsAfghanistanAfricaAlbaniaArgentinaArmeniaAsiaAustraliaAustriaBahamasBangladeshBarbadosBelarusBelgiumBelizeBoliviaBosnia and HerzegovinaBrazilBulgariaBurma/MyanmarCabo VerdeCambodiaCameroonCanadaCaribbeanCentral AmericaChileChinaColombiaCongoCosta RicaCroatiaCubaCzechoslovakiaDenmarkDominicaDominican RepublicEastern AfricaEastern AsiaEastern EuropeEcuadorEgyptEl SalvadorEnglandEritreaEthiopiaEuropeFijiFranceGermanyGhanaGreeceGrenadaGuatemalaGuyanaHaitiHondurasHong KongHungaryIndiaIndonesiaIranIraqIrelandIsraelItalyJamaicaJapanJordanKazakhstanKenyaKoreaKuwaitLaosLatin AmericaLatviaLebanonLiberiaLithuaniaMalaysiaMexicoMicronesiaMiddle AfricaMoldovaMoroccoNepalNetherlandsNicaraguaNigeriaNorth AmericaNorth MacedoniaNorthern AfricaNorthern EuropeNorwayOceaniaPakistanPanamaPeruPhilippinesPolandPortugalRomaniaRussiaSaudi ArabiaScotlandSenegalSerbiaSierra LeoneSingaporeSomaliaSouth AfricaSouth AmericaSouth Central AsiaSouth Eastern AsiaSouthern EuropeSpainSri LankaSt. Vincent and the GrenadinesSudanSwedenSwitzerlandSyriaTaiwanThailandTrinidad and TobagoTurkeyUgandaUkraineUruguayUzbekistanVenezuelaVietnamWest IndiesWestern AfricaWestern AsiaWestern EuropeYemenZaireZimbabweAzores
European
Race
Ancestry
AfghanAfricanAlaska NativeAlaskan AthabascanAlbanianAleutAlsatianAmericanApacheArabArapahoArgentineanArmenianAssyrian/Chaldean/SyriacAustralianAustrianBahamianBangladeshiBarbadianBasqueBelgianBelizeanBermudanBhutaneseBlackfeetBolivianBrazilianBritishBritish West IndianBulgarianBurmeseCajunCambodianCanadianCarpatho RusynCelticCentral AmericanCentral American IndianCherokeeCheyenneChickasawChileanChineseChippewaChoctawColombianColvilleComancheCosta RicanCreeCreekCroatianCrowCubanCypriotCzechCzechoslovakianDanishDelawareDominicanDutchDutch West IndianEastern EuropeanEcuadorianEgyptianEnglishEstonianEthiopianEuropeanFijianFilipinoFinnishFrenchFrench American IndianFrench CanadianGermanGerman RussianGhanaianGreekGuamanian/ChamorroGuatemalanGuyaneseHaitianHmongHonduranHopiHoumaHungarianIcelanderIndian (Asian)IndonesianInupiatIranianIraqiIrishIroquoisIsraeliItalianJamaicanJapaneseJordanianKenyanKiowaKoreanLaotianLatvianLebaneseLiberianLithuanianLumbeeLuxembourgerMacedonianMalaysianMalteseMarshalleseMenomineeMexicanMexican American IndianMongolianMoroccanNative HawaiianNavajoNepaleseNew ZealanderNicaraguanNigerianNorthern EuropeanNorwegianOkinawanOsageOttawaPaiutePakistaniPalestinianPanamanianParaguayanPennsylvania GermanPeruvianPimaPolishPortuguesePotawatomiPuebloPuerto RicanPuget Sound SalishRomanianRussianSalvadoranSamoanScandinavianScotch-IrishScottishSeminoleSenegaleseSerbianShoshoneSierra LeoneanSiouxSlavicSlovakSloveneSomaliSouth AfricanSouth AmericanSouth American IndianSoviet UnionSpaniardSpanishSpanish AmericanSpanish American IndianSri LankanSubsaharan AfricanSudaneseSwedishSwissSyrianTaiwaneseThaiTlingit-HaidaTohono O'OdhamTonganTrinidadian and TobagonianTsimshianTurkishU.S. Virgin IslanderUgandanUkrainianUruguayanUteVenezuelanVietnameseWelshWest IndianYakamaYaquiYugoslavianYumanYup'ikZimbabwean
Immigration
NonimmigrantsImmigrantsAfghanistanAfricaAlbaniaArgentinaArmeniaAsiaAustraliaAustriaBahamasBangladeshBarbadosBelarusBelgiumBelizeBoliviaBosnia and HerzegovinaBrazilBulgariaBurma/MyanmarCabo VerdeCambodiaCameroonCanadaCaribbeanCentral AmericaChileChinaColombiaCongoCosta RicaCroatiaCubaCzechoslovakiaDenmarkDominicaDominican RepublicEastern AfricaEastern AsiaEastern EuropeEcuadorEgyptEl SalvadorEnglandEritreaEthiopiaEuropeFijiFranceGermanyGhanaGreeceGrenadaGuatemalaGuyanaHaitiHondurasHong KongHungaryIndiaIndonesiaIranIraqIrelandIsraelItalyJamaicaJapanJordanKazakhstanKenyaKoreaKuwaitLaosLatin AmericaLatviaLebanonLiberiaLithuaniaMalaysiaMexicoMicronesiaMiddle AfricaMoldovaMoroccoNepalNetherlandsNicaraguaNigeriaNorth AmericaNorth MacedoniaNorthern AfricaNorthern EuropeNorwayOceaniaPakistanPanamaPeruPhilippinesPolandPortugalRomaniaRussiaSaudi ArabiaScotlandSenegalSerbiaSierra LeoneSingaporeSomaliaSouth AfricaSouth AmericaSouth Central AsiaSouth Eastern AsiaSouthern EuropeSpainSri LankaSt. Vincent and the GrenadinesSudanSwedenSwitzerlandSyriaTaiwanThailandTrinidad and TobagoTurkeyUgandaUkraineUruguayUzbekistanVenezuelaVietnamWest IndiesWestern AfricaWestern AsiaWestern EuropeYemenZaireZimbabweAzores
Child Poverty Among Girls Under 16
Income
Poverty
Unemployment
Labor Participation
Family Structure
Vehicle Availability
Education Level
Disability

Child Poverty Among Girls Under 16 Comparison

Cape Verdeans

Europeans

Tragic
Exceptional
19.2%
CHILD POVERTY AMONG GIRLS UNDER 16
0.3/ 100
METRIC RATING
250th/ 347
METRIC RANK
14.6%
CHILD POVERTY AMONG GIRLS UNDER 16
98.1/ 100
METRIC RATING
70th/ 347
METRIC RANK

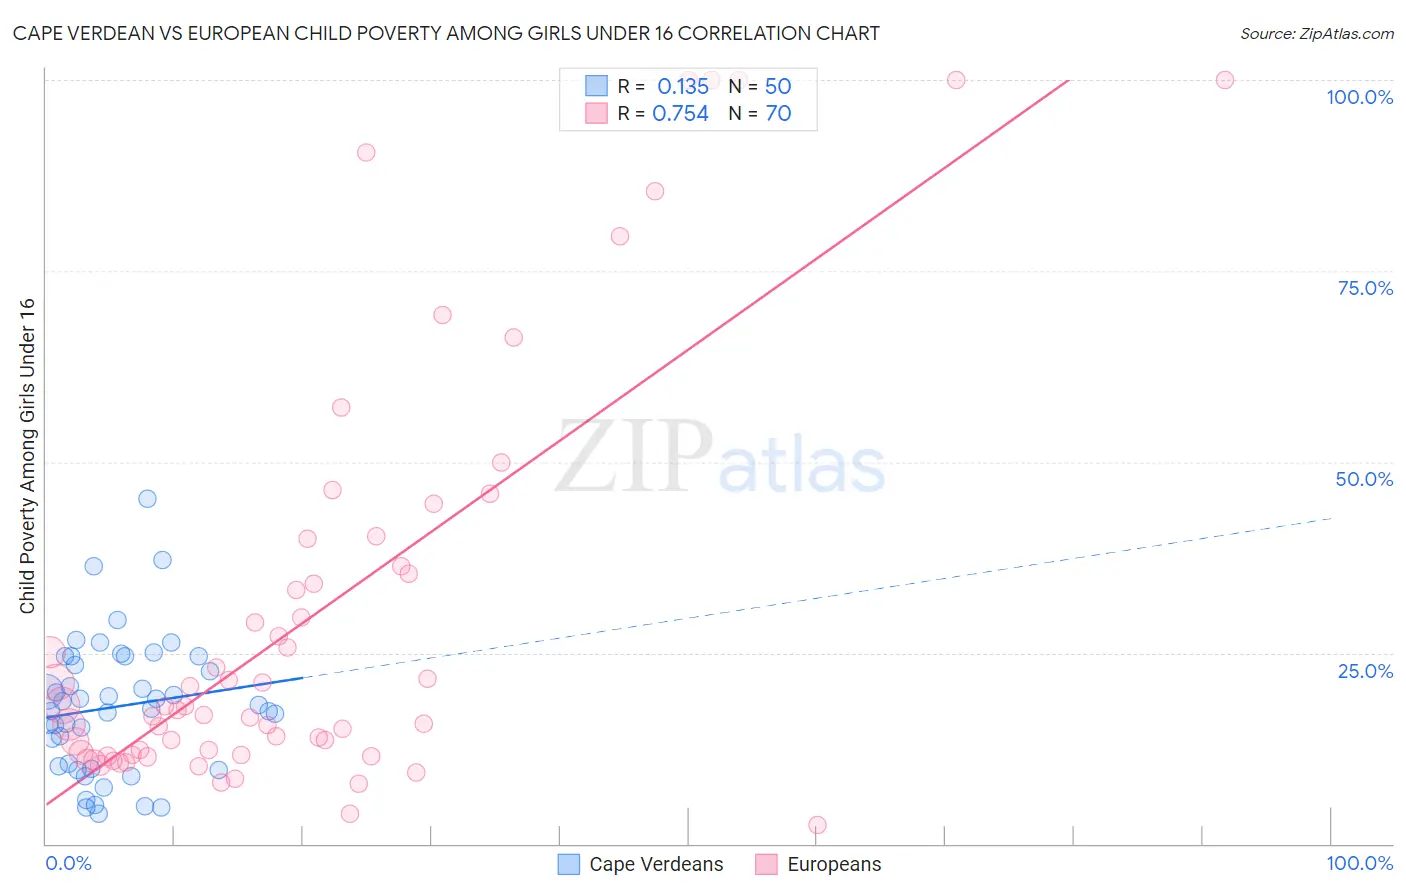
Cape Verdean vs European Child Poverty Among Girls Under 16 Correlation Chart

The statistical analysis conducted on geographies consisting of 106,748,035 people shows a poor positive correlation between the proportion of Cape Verdeans and poverty level among girls under the age of 16 in the United States with a correlation coefficient (R) of 0.135 and weighted average of 19.2%. Similarly, the statistical analysis conducted on geographies consisting of 541,040,111 people shows a strong positive correlation between the proportion of Europeans and poverty level among girls under the age of 16 in the United States with a correlation coefficient (R) of 0.754 and weighted average of 14.6%, a difference of 31.6%.
Cape Verdean vs European Child Poverty Among Girls Under 16

Child Poverty Among Girls Under 16 Correlation Summary

MeasurementCape VerdeanEuropean
Minimum3.9%2.4%
Maximum45.2%100.0%
Range41.3%97.6%
Mean17.9%29.9%
Median17.9%17.7%
Interquartile 25% (IQ1)10.2%11.7%
Interquartile 75% (IQ3)24.5%36.4%
Interquartile Range (IQR)14.3%24.7%
Standard Deviation (Sample)8.9%27.3%
Standard Deviation (Population)8.8%27.1%

Similar Demographics by Child Poverty Among Girls Under 16

Demographics Similar to Cape Verdeans by Child Poverty Among Girls Under 16

In terms of child poverty among girls under 16, the demographic groups most similar to Cape Verdeans are Potawatomi (19.2%, a difference of 0.030%), French American Indian (19.2%, a difference of 0.050%), Immigrants from Trinidad and Tobago (19.2%, a difference of 0.11%), Immigrants from Middle Africa (19.2%, a difference of 0.15%), and Immigrants from Guyana (19.3%, a difference of 0.35%).
DemographicsRating | RankChild Poverty Among Girls Under 16
Immigrants | Nicaragua
0.7
/100
|
#243
Tragic
18.8%
Ecuadorians
0.7
/100
|
#244
Tragic
18.8%
Shoshone
0.6
/100
|
#245
Tragic
18.9%
Immigrants | Laos
0.6
/100
|
#246
Tragic
18.9%
Immigrants | Ghana
0.5
/100
|
#247
Tragic
18.9%
French American Indians
0.3
/100
|
#248
Tragic
19.2%
Potawatomi
0.3
/100
|
#249
Tragic
19.2%
Cape Verdeans
0.3
/100
|
#250
Tragic
19.2%
Immigrants | Trinidad and Tobago
0.3
/100
|
#251
Tragic
19.2%
Immigrants | Middle Africa
0.3
/100
|
#252
Tragic
19.2%
Immigrants | Guyana
0.3
/100
|
#253
Tragic
19.3%
Immigrants | Western Africa
0.3
/100
|
#254
Tragic
19.3%
Immigrants | Ecuador
0.3
/100
|
#255
Tragic
19.3%
Trinidadians and Tobagonians
0.2
/100
|
#256
Tragic
19.3%
Guyanese
0.2
/100
|
#257
Tragic
19.4%

Demographics Similar to Europeans by Child Poverty Among Girls Under 16

In terms of child poverty among girls under 16, the demographic groups most similar to Europeans are Slovene (14.6%, a difference of 0.040%), Immigrants from Netherlands (14.6%, a difference of 0.060%), Immigrants from Poland (14.6%, a difference of 0.12%), Immigrants from Austria (14.6%, a difference of 0.16%), and Taiwanese (14.6%, a difference of 0.19%).
DemographicsRating | RankChild Poverty Among Girls Under 16
Immigrants | Europe
98.7
/100
|
#63
Exceptional
14.4%
Immigrants | Philippines
98.6
/100
|
#64
Exceptional
14.4%
Immigrants | Sweden
98.6
/100
|
#65
Exceptional
14.5%
Immigrants | Belgium
98.5
/100
|
#66
Exceptional
14.5%
Laotians
98.4
/100
|
#67
Exceptional
14.5%
Immigrants | Argentina
98.3
/100
|
#68
Exceptional
14.6%
Immigrants | Poland
98.2
/100
|
#69
Exceptional
14.6%
Europeans
98.1
/100
|
#70
Exceptional
14.6%
Slovenes
98.1
/100
|
#71
Exceptional
14.6%
Immigrants | Netherlands
98.1
/100
|
#72
Exceptional
14.6%
Immigrants | Austria
98.0
/100
|
#73
Exceptional
14.6%
Taiwanese
98.0
/100
|
#74
Exceptional
14.6%
Immigrants | Eastern Europe
98.0
/100
|
#75
Exceptional
14.6%
Immigrants | Russia
97.9
/100
|
#76
Exceptional
14.7%
Tlingit-Haida
97.9
/100
|
#77
Exceptional
14.7%