Guamanian/Chamorro vs European Child Poverty Among Girls Under 16
COMPARE
Guamanian/Chamorro
European
Child Poverty Among Girls Under 16
Child Poverty Among Girls Under 16 Comparison
Guamanians/Chamorros
Europeans
15.9%
CHILD POVERTY AMONG GIRLS UNDER 16
75.3/ 100
METRIC RATING
158th/ 347
METRIC RANK
14.6%
CHILD POVERTY AMONG GIRLS UNDER 16
98.1/ 100
METRIC RATING
70th/ 347
METRIC RANK
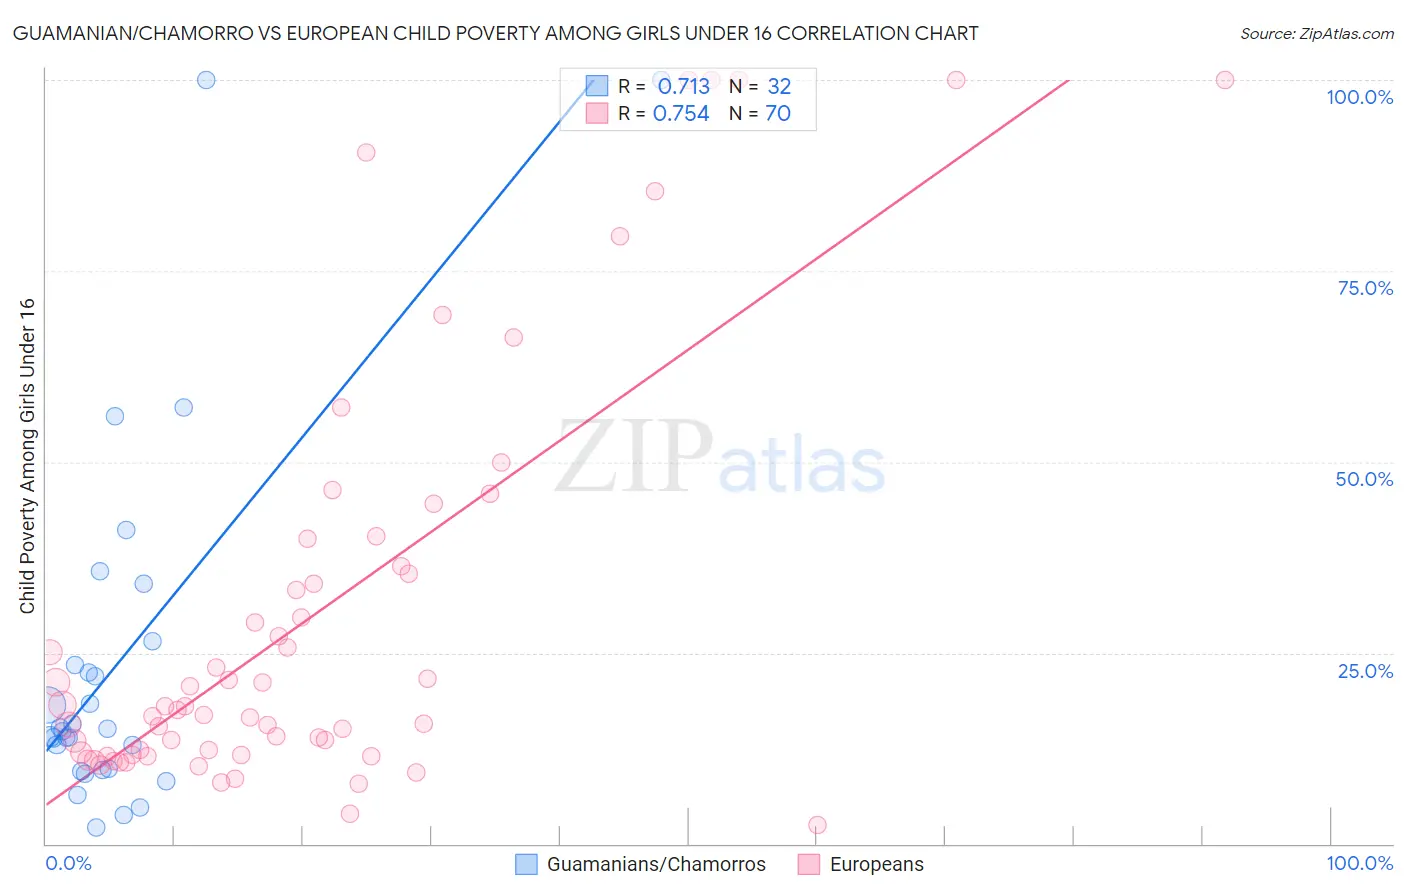
Guamanian/Chamorro vs European Child Poverty Among Girls Under 16 Correlation Chart
The statistical analysis conducted on geographies consisting of 220,387,643 people shows a strong positive correlation between the proportion of Guamanians/Chamorros and poverty level among girls under the age of 16 in the United States with a correlation coefficient (R) of 0.713 and weighted average of 15.9%. Similarly, the statistical analysis conducted on geographies consisting of 541,040,111 people shows a strong positive correlation between the proportion of Europeans and poverty level among girls under the age of 16 in the United States with a correlation coefficient (R) of 0.754 and weighted average of 14.6%, a difference of 9.2%.
Child Poverty Among Girls Under 16 Correlation Summary
| Measurement | Guamanian/Chamorro | European |
| Minimum | 2.0% | 2.4% |
| Maximum | 100.0% | 100.0% |
| Range | 98.0% | 97.6% |
| Mean | 23.8% | 29.9% |
| Median | 14.9% | 17.7% |
| Interquartile 25% (IQ1) | 9.7% | 11.7% |
| Interquartile 75% (IQ3) | 24.9% | 36.4% |
| Interquartile Range (IQR) | 15.2% | 24.7% |
| Standard Deviation (Sample) | 24.0% | 27.3% |
| Standard Deviation (Population) | 23.7% | 27.1% |
Similar Demographics by Child Poverty Among Girls Under 16
Demographics Similar to Guamanians/Chamorros by Child Poverty Among Girls Under 16
In terms of child poverty among girls under 16, the demographic groups most similar to Guamanians/Chamorros are Slovak (15.9%, a difference of 0.010%), Immigrants from Fiji (15.9%, a difference of 0.12%), Colombian (15.9%, a difference of 0.12%), Syrian (15.9%, a difference of 0.22%), and Immigrants from Chile (15.9%, a difference of 0.23%).
| Demographics | Rating | Rank | Child Poverty Among Girls Under 16 |
| Venezuelans | 80.1 /100 | #151 | Excellent 15.8% |
| Immigrants | Kuwait | 79.4 /100 | #152 | Good 15.8% |
| Immigrants | Nepal | 78.5 /100 | #153 | Good 15.9% |
| Immigrants | Chile | 76.7 /100 | #154 | Good 15.9% |
| Syrians | 76.7 /100 | #155 | Good 15.9% |
| Immigrants | Fiji | 76.1 /100 | #156 | Good 15.9% |
| Colombians | 76.1 /100 | #157 | Good 15.9% |
| Guamanians/Chamorros | 75.3 /100 | #158 | Good 15.9% |
| Slovaks | 75.2 /100 | #159 | Good 15.9% |
| French | 72.8 /100 | #160 | Good 16.0% |
| Immigrants | Northern Africa | 72.0 /100 | #161 | Good 16.0% |
| French Canadians | 68.7 /100 | #162 | Good 16.1% |
| Immigrants | Oceania | 68.4 /100 | #163 | Good 16.1% |
| Immigrants | Colombia | 67.8 /100 | #164 | Good 16.1% |
| Immigrants | Germany | 67.3 /100 | #165 | Good 16.1% |
Demographics Similar to Europeans by Child Poverty Among Girls Under 16
In terms of child poverty among girls under 16, the demographic groups most similar to Europeans are Slovene (14.6%, a difference of 0.040%), Immigrants from Netherlands (14.6%, a difference of 0.060%), Immigrants from Poland (14.6%, a difference of 0.12%), Immigrants from Austria (14.6%, a difference of 0.16%), and Taiwanese (14.6%, a difference of 0.19%).
| Demographics | Rating | Rank | Child Poverty Among Girls Under 16 |
| Immigrants | Europe | 98.7 /100 | #63 | Exceptional 14.4% |
| Immigrants | Philippines | 98.6 /100 | #64 | Exceptional 14.4% |
| Immigrants | Sweden | 98.6 /100 | #65 | Exceptional 14.5% |
| Immigrants | Belgium | 98.5 /100 | #66 | Exceptional 14.5% |
| Laotians | 98.4 /100 | #67 | Exceptional 14.5% |
| Immigrants | Argentina | 98.3 /100 | #68 | Exceptional 14.6% |
| Immigrants | Poland | 98.2 /100 | #69 | Exceptional 14.6% |
| Europeans | 98.1 /100 | #70 | Exceptional 14.6% |
| Slovenes | 98.1 /100 | #71 | Exceptional 14.6% |
| Immigrants | Netherlands | 98.1 /100 | #72 | Exceptional 14.6% |
| Immigrants | Austria | 98.0 /100 | #73 | Exceptional 14.6% |
| Taiwanese | 98.0 /100 | #74 | Exceptional 14.6% |
| Immigrants | Eastern Europe | 98.0 /100 | #75 | Exceptional 14.6% |
| Immigrants | Russia | 97.9 /100 | #76 | Exceptional 14.7% |
| Tlingit-Haida | 97.9 /100 | #77 | Exceptional 14.7% |