Bermudan vs European Child Poverty Among Girls Under 16
COMPARE
Bermudan
European
Child Poverty Among Girls Under 16
Child Poverty Among Girls Under 16 Comparison
Bermudans
Europeans
18.1%
CHILD POVERTY AMONG GIRLS UNDER 16
2.8/ 100
METRIC RATING
224th/ 347
METRIC RANK
14.6%
CHILD POVERTY AMONG GIRLS UNDER 16
98.1/ 100
METRIC RATING
70th/ 347
METRIC RANK
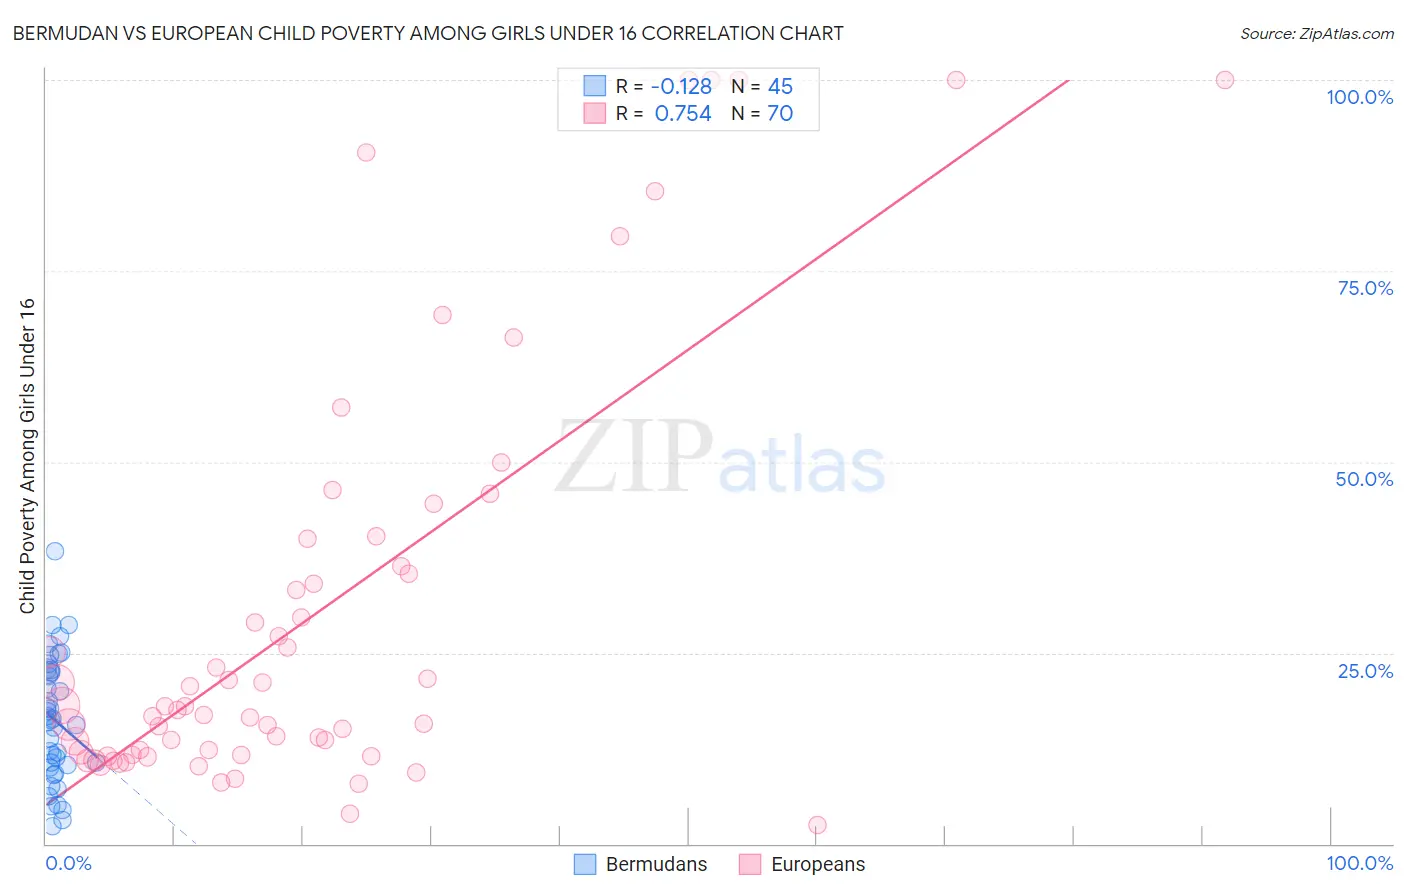
Bermudan vs European Child Poverty Among Girls Under 16 Correlation Chart
The statistical analysis conducted on geographies consisting of 55,609,827 people shows a poor negative correlation between the proportion of Bermudans and poverty level among girls under the age of 16 in the United States with a correlation coefficient (R) of -0.128 and weighted average of 18.1%. Similarly, the statistical analysis conducted on geographies consisting of 541,040,111 people shows a strong positive correlation between the proportion of Europeans and poverty level among girls under the age of 16 in the United States with a correlation coefficient (R) of 0.754 and weighted average of 14.6%, a difference of 24.3%.
Child Poverty Among Girls Under 16 Correlation Summary
| Measurement | Bermudan | European |
| Minimum | 2.4% | 2.4% |
| Maximum | 38.3% | 100.0% |
| Range | 35.9% | 97.6% |
| Mean | 16.2% | 29.9% |
| Median | 16.2% | 17.7% |
| Interquartile 25% (IQ1) | 10.2% | 11.7% |
| Interquartile 75% (IQ3) | 22.7% | 36.4% |
| Interquartile Range (IQR) | 12.5% | 24.7% |
| Standard Deviation (Sample) | 8.1% | 27.3% |
| Standard Deviation (Population) | 8.0% | 27.1% |
Similar Demographics by Child Poverty Among Girls Under 16
Demographics Similar to Bermudans by Child Poverty Among Girls Under 16
In terms of child poverty among girls under 16, the demographic groups most similar to Bermudans are Immigrants from Armenia (18.1%, a difference of 0.070%), Immigrants from Cambodia (18.1%, a difference of 0.080%), Immigrants from Africa (18.2%, a difference of 0.10%), Nicaraguan (18.2%, a difference of 0.42%), and Immigrants from Micronesia (18.0%, a difference of 0.60%).
| Demographics | Rating | Rank | Child Poverty Among Girls Under 16 |
| Japanese | 5.3 /100 | #217 | Tragic 17.8% |
| Alaska Natives | 5.2 /100 | #218 | Tragic 17.8% |
| Immigrants | Panama | 4.7 /100 | #219 | Tragic 17.9% |
| Cubans | 4.1 /100 | #220 | Tragic 18.0% |
| Immigrants | Micronesia | 3.5 /100 | #221 | Tragic 18.0% |
| Immigrants | Cambodia | 2.9 /100 | #222 | Tragic 18.1% |
| Immigrants | Armenia | 2.9 /100 | #223 | Tragic 18.1% |
| Bermudans | 2.8 /100 | #224 | Tragic 18.1% |
| Immigrants | Africa | 2.7 /100 | #225 | Tragic 18.2% |
| Nicaraguans | 2.4 /100 | #226 | Tragic 18.2% |
| Immigrants | Nonimmigrants | 2.0 /100 | #227 | Tragic 18.3% |
| Alaskan Athabascans | 2.0 /100 | #228 | Tragic 18.3% |
| Ghanaians | 1.4 /100 | #229 | Tragic 18.5% |
| Osage | 1.3 /100 | #230 | Tragic 18.5% |
| Cree | 1.3 /100 | #231 | Tragic 18.5% |
Demographics Similar to Europeans by Child Poverty Among Girls Under 16
In terms of child poverty among girls under 16, the demographic groups most similar to Europeans are Slovene (14.6%, a difference of 0.040%), Immigrants from Netherlands (14.6%, a difference of 0.060%), Immigrants from Poland (14.6%, a difference of 0.12%), Immigrants from Austria (14.6%, a difference of 0.16%), and Taiwanese (14.6%, a difference of 0.19%).
| Demographics | Rating | Rank | Child Poverty Among Girls Under 16 |
| Immigrants | Europe | 98.7 /100 | #63 | Exceptional 14.4% |
| Immigrants | Philippines | 98.6 /100 | #64 | Exceptional 14.4% |
| Immigrants | Sweden | 98.6 /100 | #65 | Exceptional 14.5% |
| Immigrants | Belgium | 98.5 /100 | #66 | Exceptional 14.5% |
| Laotians | 98.4 /100 | #67 | Exceptional 14.5% |
| Immigrants | Argentina | 98.3 /100 | #68 | Exceptional 14.6% |
| Immigrants | Poland | 98.2 /100 | #69 | Exceptional 14.6% |
| Europeans | 98.1 /100 | #70 | Exceptional 14.6% |
| Slovenes | 98.1 /100 | #71 | Exceptional 14.6% |
| Immigrants | Netherlands | 98.1 /100 | #72 | Exceptional 14.6% |
| Immigrants | Austria | 98.0 /100 | #73 | Exceptional 14.6% |
| Taiwanese | 98.0 /100 | #74 | Exceptional 14.6% |
| Immigrants | Eastern Europe | 98.0 /100 | #75 | Exceptional 14.6% |
| Immigrants | Russia | 97.9 /100 | #76 | Exceptional 14.7% |
| Tlingit-Haida | 97.9 /100 | #77 | Exceptional 14.7% |