Cambodian vs Immigrants from Bahamas Single Male Poverty
COMPARE
Cambodian
Immigrants from Bahamas
Single Male Poverty
Single Male Poverty Comparison
Cambodians
Immigrants from Bahamas
11.8%
SINGLE MALE POVERTY
99.8/ 100
METRIC RATING
61st/ 347
METRIC RANK
14.4%
SINGLE MALE POVERTY
0.0/ 100
METRIC RATING
284th/ 347
METRIC RANK
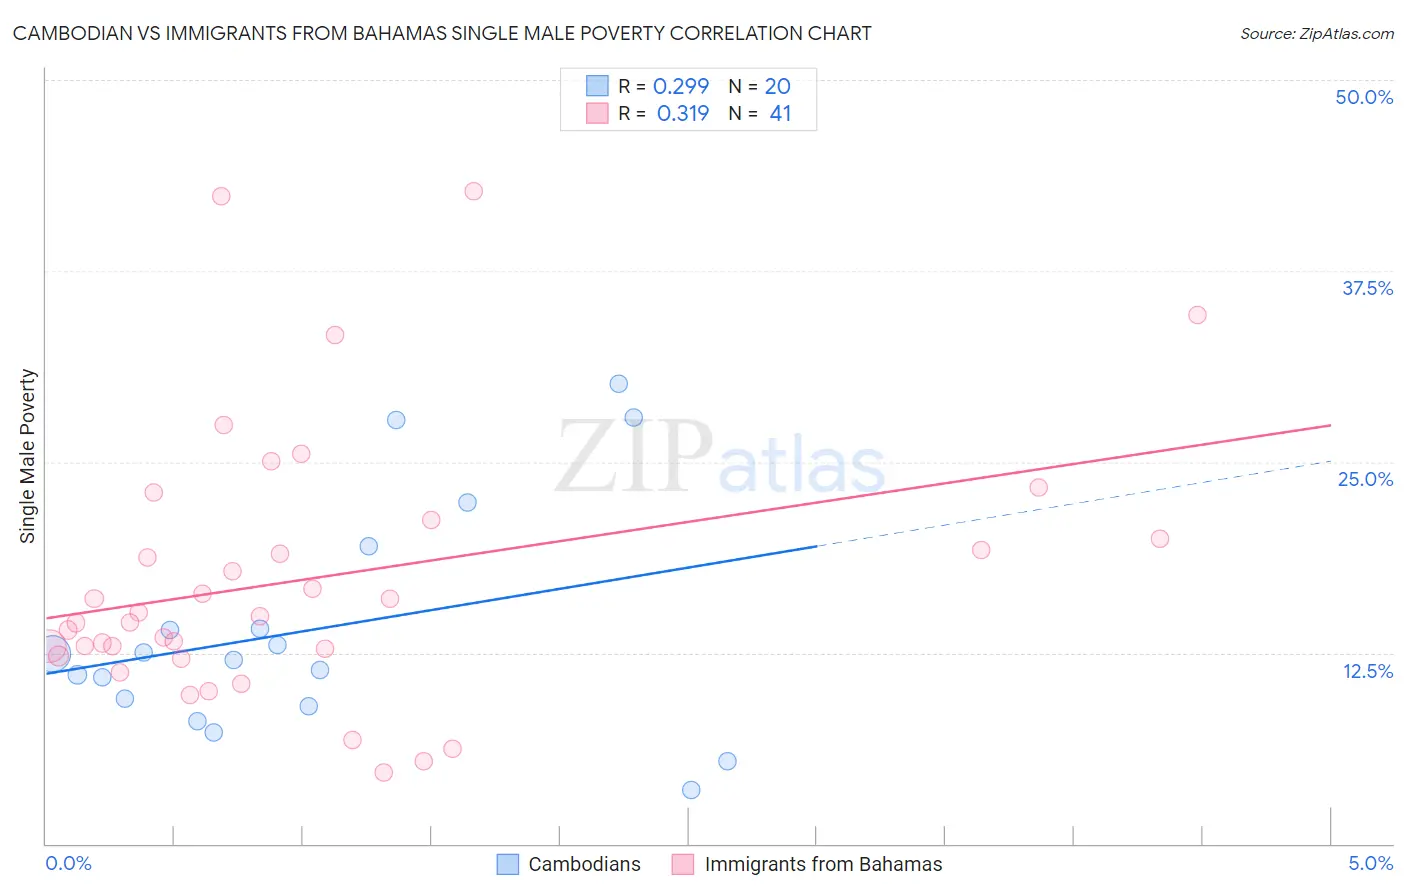
Cambodian vs Immigrants from Bahamas Single Male Poverty Correlation Chart
The statistical analysis conducted on geographies consisting of 97,412,896 people shows a weak positive correlation between the proportion of Cambodians and poverty level among single males in the United States with a correlation coefficient (R) of 0.299 and weighted average of 11.8%. Similarly, the statistical analysis conducted on geographies consisting of 101,111,257 people shows a mild positive correlation between the proportion of Immigrants from Bahamas and poverty level among single males in the United States with a correlation coefficient (R) of 0.319 and weighted average of 14.4%, a difference of 22.2%.
Single Male Poverty Correlation Summary
| Measurement | Cambodian | Immigrants from Bahamas |
| Minimum | 3.5% | 4.7% |
| Maximum | 30.1% | 42.7% |
| Range | 26.6% | 38.1% |
| Mean | 14.1% | 17.4% |
| Median | 12.2% | 14.9% |
| Interquartile 25% (IQ1) | 9.2% | 12.5% |
| Interquartile 75% (IQ3) | 16.8% | 20.6% |
| Interquartile Range (IQR) | 7.5% | 8.1% |
| Standard Deviation (Sample) | 7.6% | 8.8% |
| Standard Deviation (Population) | 7.4% | 8.7% |
Similar Demographics by Single Male Poverty
Demographics Similar to Cambodians by Single Male Poverty
In terms of single male poverty, the demographic groups most similar to Cambodians are Peruvian (11.8%, a difference of 0.020%), Brazilian (11.8%, a difference of 0.23%), Immigrants from Brazil (11.7%, a difference of 0.32%), Immigrants from Romania (11.7%, a difference of 0.34%), and Immigrants from Sri Lanka (11.8%, a difference of 0.38%).
| Demographics | Rating | Rank | Single Male Poverty |
| Immigrants | Uzbekistan | 99.9 /100 | #54 | Exceptional 11.7% |
| Cypriots | 99.9 /100 | #55 | Exceptional 11.7% |
| Burmese | 99.8 /100 | #56 | Exceptional 11.7% |
| Immigrants | Romania | 99.8 /100 | #57 | Exceptional 11.7% |
| Immigrants | Brazil | 99.8 /100 | #58 | Exceptional 11.7% |
| Brazilians | 99.8 /100 | #59 | Exceptional 11.8% |
| Peruvians | 99.8 /100 | #60 | Exceptional 11.8% |
| Cambodians | 99.8 /100 | #61 | Exceptional 11.8% |
| Immigrants | Sri Lanka | 99.7 /100 | #62 | Exceptional 11.8% |
| Immigrants | Belarus | 99.7 /100 | #63 | Exceptional 11.8% |
| Immigrants | Eastern Europe | 99.6 /100 | #64 | Exceptional 11.8% |
| Laotians | 99.6 /100 | #65 | Exceptional 11.9% |
| Immigrants | Uruguay | 99.6 /100 | #66 | Exceptional 11.9% |
| Immigrants | Ukraine | 99.6 /100 | #67 | Exceptional 11.9% |
| Immigrants | Croatia | 99.6 /100 | #68 | Exceptional 11.9% |
Demographics Similar to Immigrants from Bahamas by Single Male Poverty
In terms of single male poverty, the demographic groups most similar to Immigrants from Bahamas are French (14.4%, a difference of 0.13%), Celtic (14.5%, a difference of 0.46%), Iroquois (14.5%, a difference of 0.58%), White/Caucasian (14.5%, a difference of 0.59%), and Immigrants from Dominica (14.5%, a difference of 0.67%).
| Demographics | Rating | Rank | Single Male Poverty |
| Immigrants | Honduras | 0.0 /100 | #277 | Tragic 14.1% |
| Slovaks | 0.0 /100 | #278 | Tragic 14.1% |
| Indonesians | 0.0 /100 | #279 | Tragic 14.1% |
| Hmong | 0.0 /100 | #280 | Tragic 14.2% |
| Hispanics or Latinos | 0.0 /100 | #281 | Tragic 14.2% |
| Spanish Americans | 0.0 /100 | #282 | Tragic 14.2% |
| Yaqui | 0.0 /100 | #283 | Tragic 14.2% |
| Immigrants | Bahamas | 0.0 /100 | #284 | Tragic 14.4% |
| French | 0.0 /100 | #285 | Tragic 14.4% |
| Celtics | 0.0 /100 | #286 | Tragic 14.5% |
| Iroquois | 0.0 /100 | #287 | Tragic 14.5% |
| Whites/Caucasians | 0.0 /100 | #288 | Tragic 14.5% |
| Immigrants | Dominica | 0.0 /100 | #289 | Tragic 14.5% |
| U.S. Virgin Islanders | 0.0 /100 | #290 | Tragic 14.5% |
| Bahamians | 0.0 /100 | #291 | Tragic 14.6% |