Cambodian vs Immigrants from Sierra Leone Single Male Poverty
COMPARE
Cambodian
Immigrants from Sierra Leone
Single Male Poverty
Single Male Poverty Comparison
Cambodians
Immigrants from Sierra Leone
11.8%
SINGLE MALE POVERTY
99.8/ 100
METRIC RATING
61st/ 347
METRIC RANK
12.5%
SINGLE MALE POVERTY
85.5/ 100
METRIC RATING
129th/ 347
METRIC RANK
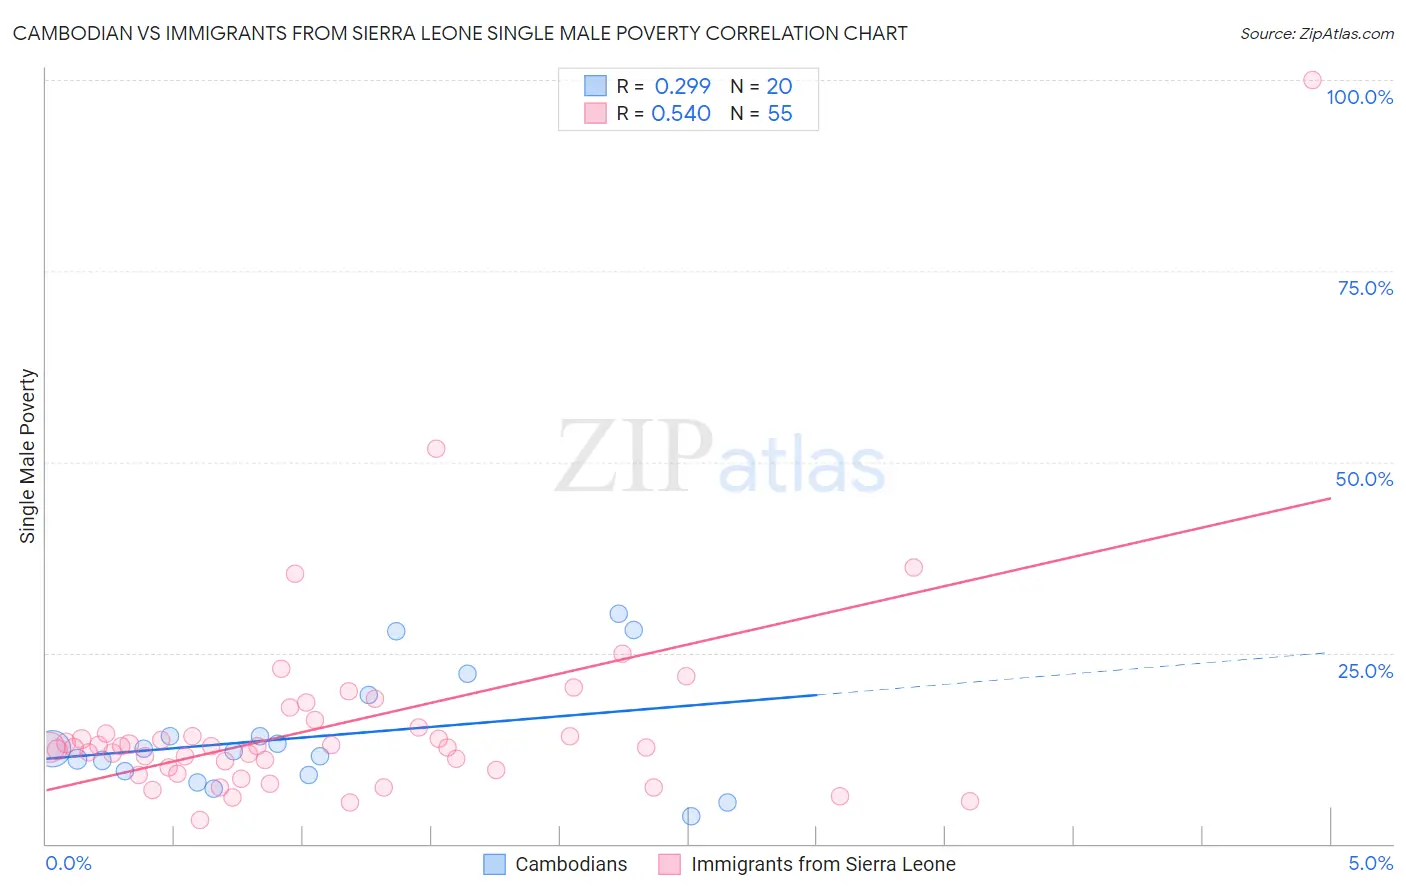
Cambodian vs Immigrants from Sierra Leone Single Male Poverty Correlation Chart
The statistical analysis conducted on geographies consisting of 97,412,896 people shows a weak positive correlation between the proportion of Cambodians and poverty level among single males in the United States with a correlation coefficient (R) of 0.299 and weighted average of 11.8%. Similarly, the statistical analysis conducted on geographies consisting of 97,204,981 people shows a substantial positive correlation between the proportion of Immigrants from Sierra Leone and poverty level among single males in the United States with a correlation coefficient (R) of 0.540 and weighted average of 12.5%, a difference of 6.1%.
Single Male Poverty Correlation Summary
| Measurement | Cambodian | Immigrants from Sierra Leone |
| Minimum | 3.5% | 3.2% |
| Maximum | 30.1% | 100.0% |
| Range | 26.6% | 96.8% |
| Mean | 14.1% | 15.6% |
| Median | 12.2% | 12.7% |
| Interquartile 25% (IQ1) | 9.2% | 9.6% |
| Interquartile 75% (IQ3) | 16.8% | 15.2% |
| Interquartile Range (IQR) | 7.5% | 5.6% |
| Standard Deviation (Sample) | 7.6% | 14.2% |
| Standard Deviation (Population) | 7.4% | 14.0% |
Similar Demographics by Single Male Poverty
Demographics Similar to Cambodians by Single Male Poverty
In terms of single male poverty, the demographic groups most similar to Cambodians are Peruvian (11.8%, a difference of 0.020%), Brazilian (11.8%, a difference of 0.23%), Immigrants from Brazil (11.7%, a difference of 0.32%), Immigrants from Romania (11.7%, a difference of 0.34%), and Immigrants from Sri Lanka (11.8%, a difference of 0.38%).
| Demographics | Rating | Rank | Single Male Poverty |
| Immigrants | Uzbekistan | 99.9 /100 | #54 | Exceptional 11.7% |
| Cypriots | 99.9 /100 | #55 | Exceptional 11.7% |
| Burmese | 99.8 /100 | #56 | Exceptional 11.7% |
| Immigrants | Romania | 99.8 /100 | #57 | Exceptional 11.7% |
| Immigrants | Brazil | 99.8 /100 | #58 | Exceptional 11.7% |
| Brazilians | 99.8 /100 | #59 | Exceptional 11.8% |
| Peruvians | 99.8 /100 | #60 | Exceptional 11.8% |
| Cambodians | 99.8 /100 | #61 | Exceptional 11.8% |
| Immigrants | Sri Lanka | 99.7 /100 | #62 | Exceptional 11.8% |
| Immigrants | Belarus | 99.7 /100 | #63 | Exceptional 11.8% |
| Immigrants | Eastern Europe | 99.6 /100 | #64 | Exceptional 11.8% |
| Laotians | 99.6 /100 | #65 | Exceptional 11.9% |
| Immigrants | Uruguay | 99.6 /100 | #66 | Exceptional 11.9% |
| Immigrants | Ukraine | 99.6 /100 | #67 | Exceptional 11.9% |
| Immigrants | Croatia | 99.6 /100 | #68 | Exceptional 11.9% |
Demographics Similar to Immigrants from Sierra Leone by Single Male Poverty
In terms of single male poverty, the demographic groups most similar to Immigrants from Sierra Leone are Ecuadorian (12.5%, a difference of 0.040%), Immigrants from Netherlands (12.5%, a difference of 0.080%), Immigrants from Nicaragua (12.5%, a difference of 0.080%), Romanian (12.5%, a difference of 0.090%), and Immigrants from Jordan (12.5%, a difference of 0.17%).
| Demographics | Rating | Rank | Single Male Poverty |
| Serbians | 87.9 /100 | #122 | Excellent 12.5% |
| Immigrants | Kenya | 87.6 /100 | #123 | Excellent 12.5% |
| Russians | 87.3 /100 | #124 | Excellent 12.5% |
| Immigrants | Jordan | 87.1 /100 | #125 | Excellent 12.5% |
| Romanians | 86.4 /100 | #126 | Excellent 12.5% |
| Immigrants | Netherlands | 86.2 /100 | #127 | Excellent 12.5% |
| Ecuadorians | 85.9 /100 | #128 | Excellent 12.5% |
| Immigrants | Sierra Leone | 85.5 /100 | #129 | Excellent 12.5% |
| Immigrants | Nicaragua | 84.8 /100 | #130 | Excellent 12.5% |
| Immigrants | Northern Europe | 83.7 /100 | #131 | Excellent 12.5% |
| Salvadorans | 83.7 /100 | #132 | Excellent 12.5% |
| Immigrants | Western Asia | 83.4 /100 | #133 | Excellent 12.5% |
| Immigrants | Ecuador | 82.1 /100 | #134 | Excellent 12.5% |
| Immigrants | Costa Rica | 81.9 /100 | #135 | Excellent 12.5% |
| Immigrants | Austria | 81.9 /100 | #136 | Excellent 12.5% |