Cambodian vs Japanese Single Male Poverty

COMPARE

Cambodian
Race
Ancestry
AfghanAfricanAlaska NativeAlaskan AthabascanAlbanianAleutAlsatianAmericanApacheArabArapahoArgentineanArmenianAssyrian/Chaldean/SyriacAustralianAustrianBahamianBangladeshiBarbadianBasqueBelgianBelizeanBermudanBhutaneseBlackfeetBolivianBrazilianBritishBritish West IndianBulgarianBurmeseCajunCambodianCanadianCape VerdeanCarpatho RusynCelticCentral AmericanCentral American IndianCherokeeCheyenneChickasawChileanChineseChippewaChoctawColombianColvilleComancheCosta RicanCreeCreekCroatianCrowCubanCypriotCzechCzechoslovakianDanishDelawareDominicanDutchDutch West IndianEastern EuropeanEcuadorianEgyptianEnglishEstonianEthiopianEuropeanFijianFilipinoFinnishFrenchFrench American IndianFrench CanadianGermanGerman RussianGhanaianGreekGuamanian/ChamorroGuatemalanGuyaneseHaitianHmongHonduranHopiHoumaHungarianIcelanderIndian (Asian)IndonesianInupiatIranianIraqiIrishIroquoisIsraeliItalianJamaicanJordanianKenyanKiowaKoreanLaotianLatvianLebaneseLiberianLithuanianLumbeeLuxembourgerMacedonianMalaysianMalteseMarshalleseMenomineeMexicanMexican American IndianMongolianMoroccanNative HawaiianNavajoNepaleseNew ZealanderNicaraguanNigerianNorthern EuropeanNorwegianOkinawanOsageOttawaPaiutePakistaniPalestinianPanamanianParaguayanPennsylvania GermanPeruvianPimaPolishPortuguesePotawatomiPuebloPuerto RicanPuget Sound SalishRomanianRussianSalvadoranSamoanScandinavianScotch-IrishScottishSeminoleSenegaleseSerbianShoshoneSierra LeoneanSiouxSlavicSlovakSloveneSomaliSouth AfricanSouth AmericanSouth American IndianSoviet UnionSpaniardSpanishSpanish AmericanSpanish American IndianSri LankanSubsaharan AfricanSudaneseSwedishSwissSyrianTaiwaneseThaiTlingit-HaidaTohono O'OdhamTonganTrinidadian and TobagonianTsimshianTurkishU.S. Virgin IslanderUgandanUkrainianUruguayanUteVenezuelanVietnameseWelshWest IndianYakamaYaquiYugoslavianYumanYup'ikZimbabwean
Immigration
NonimmigrantsImmigrantsAfghanistanAfricaAlbaniaArgentinaArmeniaAsiaAustraliaAustriaBahamasBangladeshBarbadosBelarusBelgiumBelizeBoliviaBosnia and HerzegovinaBrazilBulgariaBurma/MyanmarCabo VerdeCambodiaCameroonCanadaCaribbeanCentral AmericaChileChinaColombiaCongoCosta RicaCroatiaCubaCzechoslovakiaDenmarkDominicaDominican RepublicEastern AfricaEastern AsiaEastern EuropeEcuadorEgyptEl SalvadorEnglandEritreaEthiopiaEuropeFijiFranceGermanyGhanaGreeceGrenadaGuatemalaGuyanaHaitiHondurasHong KongHungaryIndiaIndonesiaIranIraqIrelandIsraelItalyJamaicaJapanJordanKazakhstanKenyaKoreaKuwaitLaosLatin AmericaLatviaLebanonLiberiaLithuaniaMalaysiaMexicoMicronesiaMiddle AfricaMoldovaMoroccoNepalNetherlandsNicaraguaNigeriaNorth AmericaNorth MacedoniaNorthern AfricaNorthern EuropeNorwayOceaniaPakistanPanamaPeruPhilippinesPolandPortugalRomaniaRussiaSaudi ArabiaScotlandSenegalSerbiaSierra LeoneSingaporeSomaliaSouth AfricaSouth AmericaSouth Central AsiaSouth Eastern AsiaSouthern EuropeSpainSri LankaSt. Vincent and the GrenadinesSudanSwedenSwitzerlandSyriaTaiwanThailandTrinidad and TobagoTurkeyUgandaUkraineUruguayUzbekistanVenezuelaVietnamWest IndiesWestern AfricaWestern AsiaWestern EuropeYemenZaireZimbabweAzores
Japanese
Race
Ancestry
AfghanAfricanAlaska NativeAlaskan AthabascanAlbanianAleutAlsatianAmericanApacheArabArapahoArgentineanArmenianAssyrian/Chaldean/SyriacAustralianAustrianBahamianBangladeshiBarbadianBasqueBelgianBelizeanBermudanBhutaneseBlackfeetBolivianBrazilianBritishBritish West IndianBulgarianBurmeseCajunCanadianCape VerdeanCarpatho RusynCelticCentral AmericanCentral American IndianCherokeeCheyenneChickasawChileanChineseChippewaChoctawColombianColvilleComancheCosta RicanCreeCreekCroatianCrowCubanCypriotCzechCzechoslovakianDanishDelawareDominicanDutchDutch West IndianEastern EuropeanEcuadorianEgyptianEnglishEstonianEthiopianEuropeanFijianFilipinoFinnishFrenchFrench American IndianFrench CanadianGermanGerman RussianGhanaianGreekGuamanian/ChamorroGuatemalanGuyaneseHaitianHmongHonduranHopiHoumaHungarianIcelanderIndian (Asian)IndonesianInupiatIranianIraqiIrishIroquoisIsraeliItalianJamaicanJapaneseJordanianKenyanKiowaKoreanLaotianLatvianLebaneseLiberianLithuanianLumbeeLuxembourgerMacedonianMalaysianMalteseMarshalleseMenomineeMexicanMexican American IndianMongolianMoroccanNative HawaiianNavajoNepaleseNew ZealanderNicaraguanNigerianNorthern EuropeanNorwegianOkinawanOsageOttawaPaiutePakistaniPalestinianPanamanianParaguayanPennsylvania GermanPeruvianPimaPolishPortuguesePotawatomiPuebloPuerto RicanPuget Sound SalishRomanianRussianSalvadoranSamoanScandinavianScotch-IrishScottishSeminoleSenegaleseSerbianShoshoneSierra LeoneanSiouxSlavicSlovakSloveneSomaliSouth AfricanSouth AmericanSouth American IndianSoviet UnionSpaniardSpanishSpanish AmericanSpanish American IndianSri LankanSubsaharan AfricanSudaneseSwedishSwissSyrianTaiwaneseThaiTlingit-HaidaTohono O'OdhamTonganTrinidadian and TobagonianTsimshianTurkishU.S. Virgin IslanderUgandanUkrainianUruguayanUteVenezuelanVietnameseWelshWest IndianYakamaYaquiYugoslavianYumanYup'ikZimbabwean
Immigration
NonimmigrantsImmigrantsAfghanistanAfricaAlbaniaArgentinaArmeniaAsiaAustraliaAustriaBahamasBangladeshBarbadosBelarusBelgiumBelizeBoliviaBosnia and HerzegovinaBrazilBulgariaBurma/MyanmarCabo VerdeCambodiaCameroonCanadaCaribbeanCentral AmericaChileChinaColombiaCongoCosta RicaCroatiaCubaCzechoslovakiaDenmarkDominicaDominican RepublicEastern AfricaEastern AsiaEastern EuropeEcuadorEgyptEl SalvadorEnglandEritreaEthiopiaEuropeFijiFranceGermanyGhanaGreeceGrenadaGuatemalaGuyanaHaitiHondurasHong KongHungaryIndiaIndonesiaIranIraqIrelandIsraelItalyJamaicaJapanJordanKazakhstanKenyaKoreaKuwaitLaosLatin AmericaLatviaLebanonLiberiaLithuaniaMalaysiaMexicoMicronesiaMiddle AfricaMoldovaMoroccoNepalNetherlandsNicaraguaNigeriaNorth AmericaNorth MacedoniaNorthern AfricaNorthern EuropeNorwayOceaniaPakistanPanamaPeruPhilippinesPolandPortugalRomaniaRussiaSaudi ArabiaScotlandSenegalSerbiaSierra LeoneSingaporeSomaliaSouth AfricaSouth AmericaSouth Central AsiaSouth Eastern AsiaSouthern EuropeSpainSri LankaSt. Vincent and the GrenadinesSudanSwedenSwitzerlandSyriaTaiwanThailandTrinidad and TobagoTurkeyUgandaUkraineUruguayUzbekistanVenezuelaVietnamWest IndiesWestern AfricaWestern AsiaWestern EuropeYemenZaireZimbabweAzores
Single Male Poverty
Income
Poverty
Unemployment
Labor Participation
Family Structure
Vehicle Availability
Education Level
Disability

Single Male Poverty Comparison

Cambodians

Japanese

Exceptional
Poor
11.8%
SINGLE MALE POVERTY
99.8/ 100
METRIC RATING
61st/ 347
METRIC RANK
13.1%
SINGLE MALE POVERTY
14.8/ 100
METRIC RATING
215th/ 347
METRIC RANK

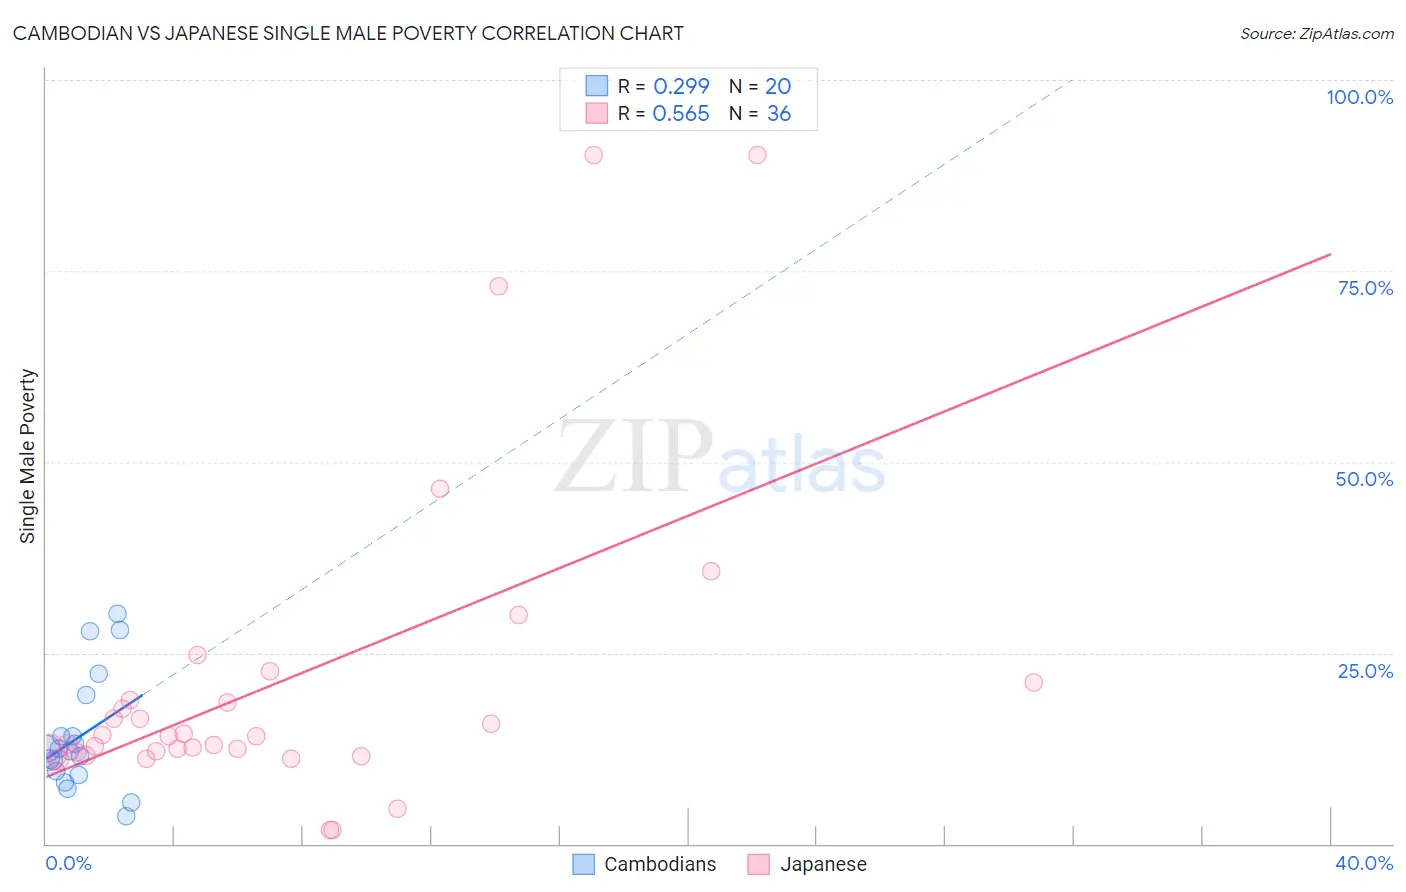
Cambodian vs Japanese Single Male Poverty Correlation Chart

The statistical analysis conducted on geographies consisting of 97,412,896 people shows a weak positive correlation between the proportion of Cambodians and poverty level among single males in the United States with a correlation coefficient (R) of 0.299 and weighted average of 11.8%. Similarly, the statistical analysis conducted on geographies consisting of 231,157,970 people shows a substantial positive correlation between the proportion of Japanese and poverty level among single males in the United States with a correlation coefficient (R) of 0.565 and weighted average of 13.1%, a difference of 11.1%.
Cambodian vs Japanese Single Male Poverty

Single Male Poverty Correlation Summary

MeasurementCambodianJapanese
Minimum3.5%1.7%
Maximum30.1%90.1%
Range26.6%88.4%
Mean14.1%21.4%
Median12.2%14.1%
Interquartile 25% (IQ1)9.2%12.0%
Interquartile 75% (IQ3)16.8%20.0%
Interquartile Range (IQR)7.5%8.0%
Standard Deviation (Sample)7.6%21.1%
Standard Deviation (Population)7.4%20.8%

Similar Demographics by Single Male Poverty

Demographics Similar to Cambodians by Single Male Poverty

In terms of single male poverty, the demographic groups most similar to Cambodians are Peruvian (11.8%, a difference of 0.020%), Brazilian (11.8%, a difference of 0.23%), Immigrants from Brazil (11.7%, a difference of 0.32%), Immigrants from Romania (11.7%, a difference of 0.34%), and Immigrants from Sri Lanka (11.8%, a difference of 0.38%).
DemographicsRating | RankSingle Male Poverty
Immigrants | Uzbekistan
99.9
/100
|
#54
Exceptional
11.7%
Cypriots
99.9
/100
|
#55
Exceptional
11.7%
Burmese
99.8
/100
|
#56
Exceptional
11.7%
Immigrants | Romania
99.8
/100
|
#57
Exceptional
11.7%
Immigrants | Brazil
99.8
/100
|
#58
Exceptional
11.7%
Brazilians
99.8
/100
|
#59
Exceptional
11.8%
Peruvians
99.8
/100
|
#60
Exceptional
11.8%
Cambodians
99.8
/100
|
#61
Exceptional
11.8%
Immigrants | Sri Lanka
99.7
/100
|
#62
Exceptional
11.8%
Immigrants | Belarus
99.7
/100
|
#63
Exceptional
11.8%
Immigrants | Eastern Europe
99.6
/100
|
#64
Exceptional
11.8%
Laotians
99.6
/100
|
#65
Exceptional
11.9%
Immigrants | Uruguay
99.6
/100
|
#66
Exceptional
11.9%
Immigrants | Ukraine
99.6
/100
|
#67
Exceptional
11.9%
Immigrants | Croatia
99.6
/100
|
#68
Exceptional
11.9%

Demographics Similar to Japanese by Single Male Poverty

In terms of single male poverty, the demographic groups most similar to Japanese are Zimbabwean (13.1%, a difference of 0.010%), Austrian (13.1%, a difference of 0.090%), Italian (13.1%, a difference of 0.11%), Senegalese (13.1%, a difference of 0.16%), and Swedish (13.1%, a difference of 0.19%).
DemographicsRating | RankSingle Male Poverty
Immigrants | Western Africa
17.6
/100
|
#208
Poor
13.1%
Mexican American Indians
17.5
/100
|
#209
Poor
13.1%
Immigrants | Haiti
16.8
/100
|
#210
Poor
13.1%
Swedes
16.8
/100
|
#211
Poor
13.1%
Senegalese
16.4
/100
|
#212
Poor
13.1%
Italians
15.9
/100
|
#213
Poor
13.1%
Zimbabweans
14.9
/100
|
#214
Poor
13.1%
Japanese
14.8
/100
|
#215
Poor
13.1%
Austrians
13.9
/100
|
#216
Poor
13.1%
Bermudans
13.0
/100
|
#217
Poor
13.1%
Scandinavians
12.9
/100
|
#218
Poor
13.1%
Immigrants | Burma/Myanmar
12.6
/100
|
#219
Poor
13.1%
Central Americans
10.9
/100
|
#220
Poor
13.2%
New Zealanders
10.7
/100
|
#221
Poor
13.2%
Immigrants | Western Europe
10.0
/100
|
#222
Poor
13.2%