Immigrants from Western Africa vs Immigrants from Ecuador Poverty
COMPARE
Immigrants from Western Africa
Immigrants from Ecuador
Poverty
Poverty Comparison
Immigrants from Western Africa
Immigrants from Ecuador
14.1%
POVERTY
0.2/ 100
METRIC RATING
248th/ 347
METRIC RANK
14.3%
POVERTY
0.1/ 100
METRIC RATING
255th/ 347
METRIC RANK
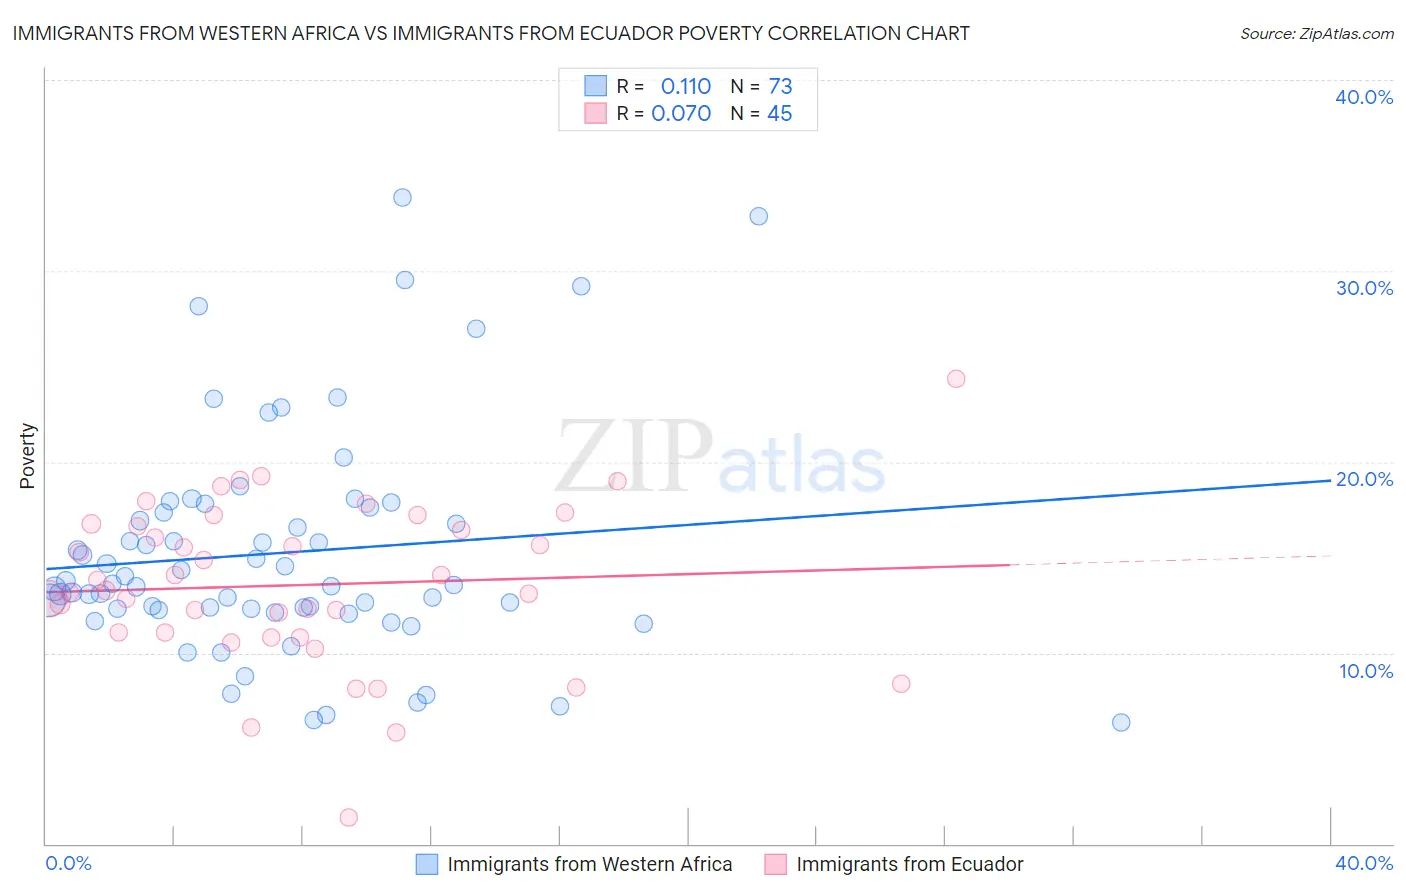
Immigrants from Western Africa vs Immigrants from Ecuador Poverty Correlation Chart
The statistical analysis conducted on geographies consisting of 357,561,912 people shows a poor positive correlation between the proportion of Immigrants from Western Africa and poverty level in the United States with a correlation coefficient (R) of 0.110 and weighted average of 14.1%. Similarly, the statistical analysis conducted on geographies consisting of 270,887,290 people shows a slight positive correlation between the proportion of Immigrants from Ecuador and poverty level in the United States with a correlation coefficient (R) of 0.070 and weighted average of 14.3%, a difference of 1.1%.
Poverty Correlation Summary
| Measurement | Immigrants from Western Africa | Immigrants from Ecuador |
| Minimum | 6.4% | 1.4% |
| Maximum | 33.8% | 24.4% |
| Range | 27.5% | 23.0% |
| Mean | 15.2% | 13.6% |
| Median | 13.5% | 13.3% |
| Interquartile 25% (IQ1) | 12.3% | 10.9% |
| Interquartile 75% (IQ3) | 17.5% | 16.7% |
| Interquartile Range (IQR) | 5.2% | 5.8% |
| Standard Deviation (Sample) | 5.9% | 4.3% |
| Standard Deviation (Population) | 5.8% | 4.2% |
Demographics Similar to Immigrants from Western Africa and Immigrants from Ecuador by Poverty
In terms of poverty, the demographic groups most similar to Immigrants from Western Africa are Liberian (14.1%, a difference of 0.020%), Immigrants from Ghana (14.2%, a difference of 0.090%), Potawatomi (14.1%, a difference of 0.30%), Cree (14.2%, a difference of 0.39%), and Immigrants from Burma/Myanmar (14.2%, a difference of 0.48%). Similarly, the demographic groups most similar to Immigrants from Ecuador are Mexican American Indian (14.3%, a difference of 0.020%), Trinidadian and Tobagonian (14.3%, a difference of 0.060%), Ottawa (14.3%, a difference of 0.070%), Immigrants from El Salvador (14.3%, a difference of 0.10%), and Immigrants from Nicaragua (14.3%, a difference of 0.34%).
| Demographics | Rating | Rank | Poverty |
| Salvadorans | 0.4 /100 | #241 | Tragic 14.0% |
| Ecuadorians | 0.4 /100 | #242 | Tragic 14.0% |
| Sudanese | 0.3 /100 | #243 | Tragic 14.0% |
| Nepalese | 0.3 /100 | #244 | Tragic 14.0% |
| Immigrants | Sudan | 0.3 /100 | #245 | Tragic 14.1% |
| Potawatomi | 0.3 /100 | #246 | Tragic 14.1% |
| Liberians | 0.2 /100 | #247 | Tragic 14.1% |
| Immigrants | Western Africa | 0.2 /100 | #248 | Tragic 14.1% |
| Immigrants | Ghana | 0.2 /100 | #249 | Tragic 14.2% |
| Cree | 0.2 /100 | #250 | Tragic 14.2% |
| Immigrants | Burma/Myanmar | 0.2 /100 | #251 | Tragic 14.2% |
| Spanish American Indians | 0.2 /100 | #252 | Tragic 14.2% |
| Immigrants | Trinidad and Tobago | 0.2 /100 | #253 | Tragic 14.2% |
| Immigrants | El Salvador | 0.1 /100 | #254 | Tragic 14.3% |
| Immigrants | Ecuador | 0.1 /100 | #255 | Tragic 14.3% |
| Mexican American Indians | 0.1 /100 | #256 | Tragic 14.3% |
| Trinidadians and Tobagonians | 0.1 /100 | #257 | Tragic 14.3% |
| Ottawa | 0.1 /100 | #258 | Tragic 14.3% |
| Immigrants | Nicaragua | 0.1 /100 | #259 | Tragic 14.3% |
| Cape Verdeans | 0.1 /100 | #260 | Tragic 14.4% |
| Cherokee | 0.1 /100 | #261 | Tragic 14.4% |