Swiss vs Immigrants from Ecuador Poverty
COMPARE
Swiss
Immigrants from Ecuador
Poverty
Poverty Comparison
Swiss
Immigrants from Ecuador
11.2%
POVERTY
97.7/ 100
METRIC RATING
64th/ 347
METRIC RANK
14.3%
POVERTY
0.1/ 100
METRIC RATING
255th/ 347
METRIC RANK
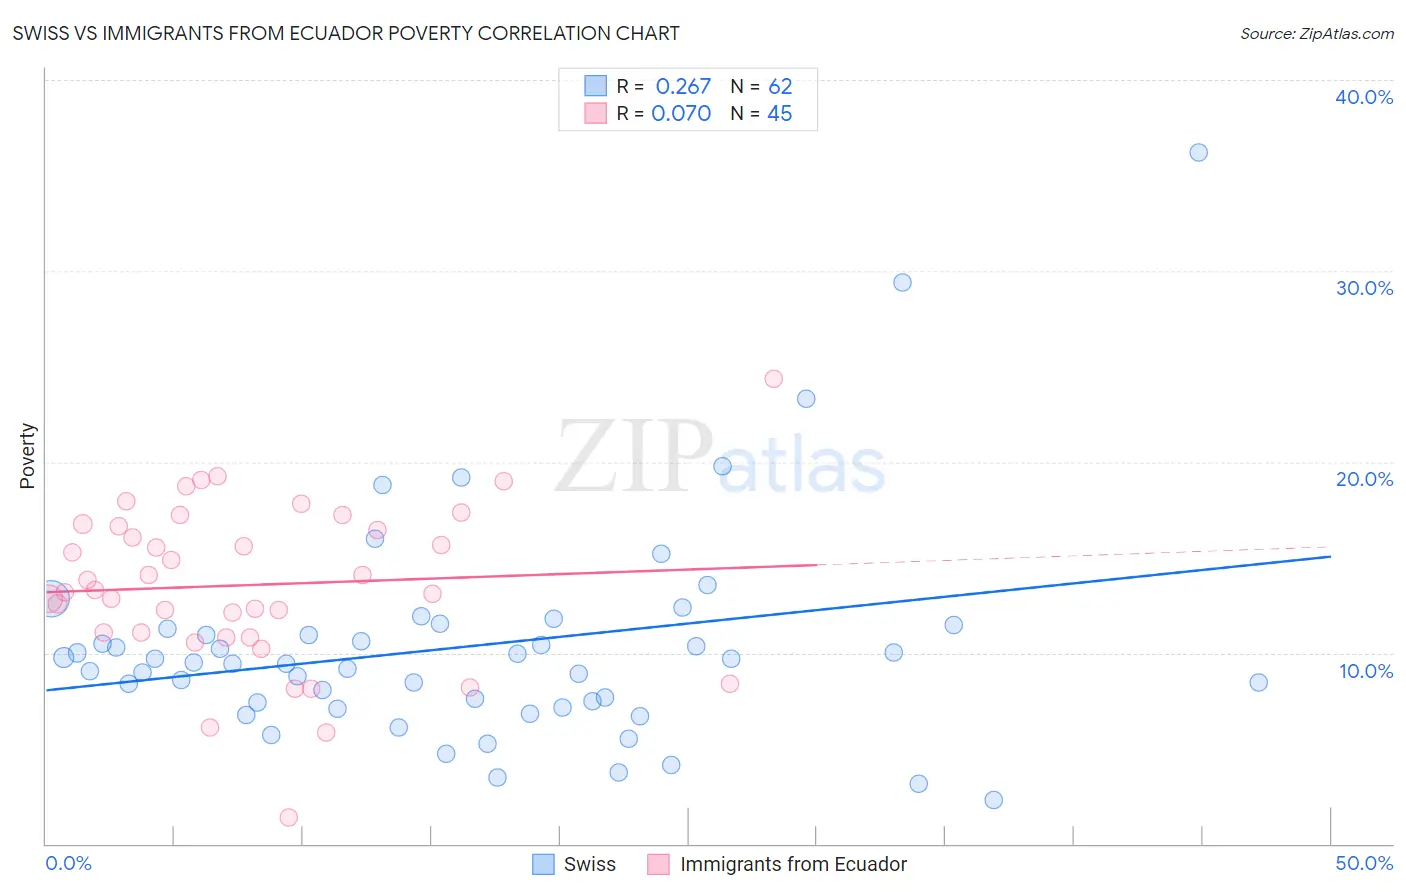
Swiss vs Immigrants from Ecuador Poverty Correlation Chart
The statistical analysis conducted on geographies consisting of 464,705,995 people shows a weak positive correlation between the proportion of Swiss and poverty level in the United States with a correlation coefficient (R) of 0.267 and weighted average of 11.2%. Similarly, the statistical analysis conducted on geographies consisting of 270,887,290 people shows a slight positive correlation between the proportion of Immigrants from Ecuador and poverty level in the United States with a correlation coefficient (R) of 0.070 and weighted average of 14.3%, a difference of 27.6%.
Poverty Correlation Summary
| Measurement | Swiss | Immigrants from Ecuador |
| Minimum | 2.3% | 1.4% |
| Maximum | 36.2% | 24.4% |
| Range | 33.9% | 23.0% |
| Mean | 10.3% | 13.6% |
| Median | 9.5% | 13.3% |
| Interquartile 25% (IQ1) | 7.4% | 10.9% |
| Interquartile 75% (IQ3) | 11.3% | 16.7% |
| Interquartile Range (IQR) | 3.9% | 5.8% |
| Standard Deviation (Sample) | 5.7% | 4.3% |
| Standard Deviation (Population) | 5.7% | 4.2% |
Similar Demographics by Poverty
Demographics Similar to Swiss by Poverty
In terms of poverty, the demographic groups most similar to Swiss are Immigrants from Asia (11.2%, a difference of 0.13%), Immigrants from Netherlands (11.2%, a difference of 0.20%), Austrian (11.2%, a difference of 0.22%), Ukrainian (11.2%, a difference of 0.22%), and Immigrants from Australia (11.2%, a difference of 0.24%).
| Demographics | Rating | Rank | Poverty |
| Scandinavians | 98.2 /100 | #57 | Exceptional 11.1% |
| Germans | 98.1 /100 | #58 | Exceptional 11.1% |
| Immigrants | Europe | 98.0 /100 | #59 | Exceptional 11.2% |
| Immigrants | Sri Lanka | 97.9 /100 | #60 | Exceptional 11.2% |
| Immigrants | Italy | 97.9 /100 | #61 | Exceptional 11.2% |
| Austrians | 97.8 /100 | #62 | Exceptional 11.2% |
| Ukrainians | 97.8 /100 | #63 | Exceptional 11.2% |
| Swiss | 97.7 /100 | #64 | Exceptional 11.2% |
| Immigrants | Asia | 97.5 /100 | #65 | Exceptional 11.2% |
| Immigrants | Netherlands | 97.5 /100 | #66 | Exceptional 11.2% |
| Immigrants | Australia | 97.4 /100 | #67 | Exceptional 11.2% |
| Slovaks | 97.4 /100 | #68 | Exceptional 11.2% |
| Serbians | 97.4 /100 | #69 | Exceptional 11.2% |
| Immigrants | Canada | 97.3 /100 | #70 | Exceptional 11.3% |
| Zimbabweans | 97.3 /100 | #71 | Exceptional 11.3% |
Demographics Similar to Immigrants from Ecuador by Poverty
In terms of poverty, the demographic groups most similar to Immigrants from Ecuador are Mexican American Indian (14.3%, a difference of 0.020%), Trinidadian and Tobagonian (14.3%, a difference of 0.060%), Ottawa (14.3%, a difference of 0.070%), Immigrants from El Salvador (14.3%, a difference of 0.10%), and Immigrants from Nicaragua (14.3%, a difference of 0.34%).
| Demographics | Rating | Rank | Poverty |
| Immigrants | Western Africa | 0.2 /100 | #248 | Tragic 14.1% |
| Immigrants | Ghana | 0.2 /100 | #249 | Tragic 14.2% |
| Cree | 0.2 /100 | #250 | Tragic 14.2% |
| Immigrants | Burma/Myanmar | 0.2 /100 | #251 | Tragic 14.2% |
| Spanish American Indians | 0.2 /100 | #252 | Tragic 14.2% |
| Immigrants | Trinidad and Tobago | 0.2 /100 | #253 | Tragic 14.2% |
| Immigrants | El Salvador | 0.1 /100 | #254 | Tragic 14.3% |
| Immigrants | Ecuador | 0.1 /100 | #255 | Tragic 14.3% |
| Mexican American Indians | 0.1 /100 | #256 | Tragic 14.3% |
| Trinidadians and Tobagonians | 0.1 /100 | #257 | Tragic 14.3% |
| Ottawa | 0.1 /100 | #258 | Tragic 14.3% |
| Immigrants | Nicaragua | 0.1 /100 | #259 | Tragic 14.3% |
| Cape Verdeans | 0.1 /100 | #260 | Tragic 14.4% |
| Cherokee | 0.1 /100 | #261 | Tragic 14.4% |
| Immigrants | Liberia | 0.1 /100 | #262 | Tragic 14.4% |