Immigrants from Czechoslovakia vs Immigrants from Ecuador Poverty
COMPARE
Immigrants from Czechoslovakia
Immigrants from Ecuador
Poverty
Poverty Comparison
Immigrants from Czechoslovakia
Immigrants from Ecuador
11.0%
POVERTY
98.9/ 100
METRIC RATING
46th/ 347
METRIC RANK
14.3%
POVERTY
0.1/ 100
METRIC RATING
255th/ 347
METRIC RANK
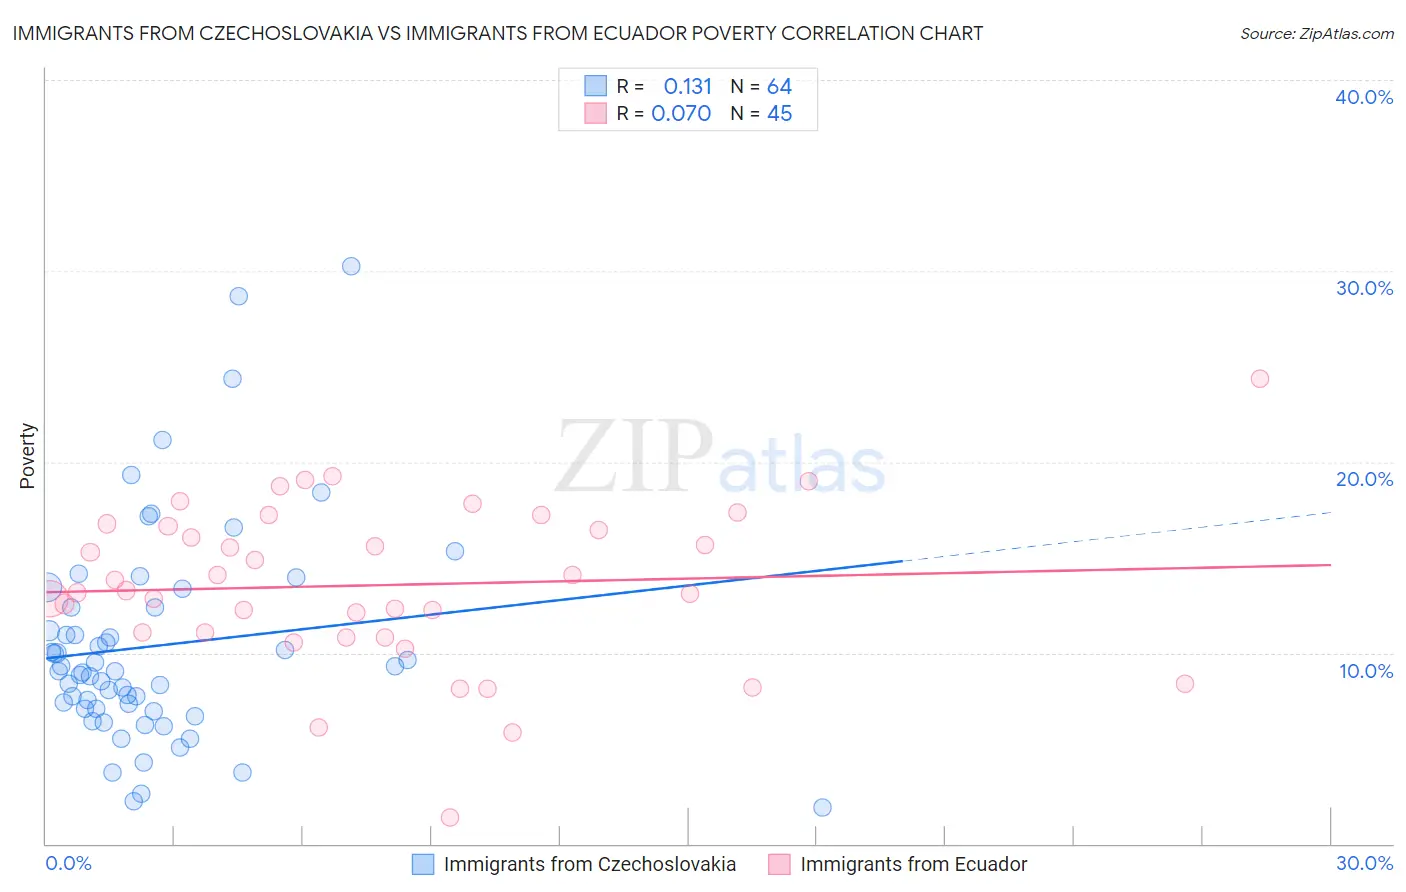
Immigrants from Czechoslovakia vs Immigrants from Ecuador Poverty Correlation Chart
The statistical analysis conducted on geographies consisting of 195,452,968 people shows a poor positive correlation between the proportion of Immigrants from Czechoslovakia and poverty level in the United States with a correlation coefficient (R) of 0.131 and weighted average of 11.0%. Similarly, the statistical analysis conducted on geographies consisting of 270,887,290 people shows a slight positive correlation between the proportion of Immigrants from Ecuador and poverty level in the United States with a correlation coefficient (R) of 0.070 and weighted average of 14.3%, a difference of 30.3%.
Poverty Correlation Summary
| Measurement | Immigrants from Czechoslovakia | Immigrants from Ecuador |
| Minimum | 1.9% | 1.4% |
| Maximum | 30.2% | 24.4% |
| Range | 28.3% | 23.0% |
| Mean | 10.4% | 13.6% |
| Median | 9.1% | 13.3% |
| Interquartile 25% (IQ1) | 7.1% | 10.9% |
| Interquartile 75% (IQ3) | 12.4% | 16.7% |
| Interquartile Range (IQR) | 5.3% | 5.8% |
| Standard Deviation (Sample) | 5.6% | 4.3% |
| Standard Deviation (Population) | 5.6% | 4.2% |
Similar Demographics by Poverty
Demographics Similar to Immigrants from Czechoslovakia by Poverty
In terms of poverty, the demographic groups most similar to Immigrants from Czechoslovakia are Immigrants from Romania (11.0%, a difference of 0.010%), Slovene (11.0%, a difference of 0.060%), Immigrants from Japan (11.0%, a difference of 0.070%), Turkish (11.0%, a difference of 0.080%), and Asian (11.0%, a difference of 0.10%).
| Demographics | Rating | Rank | Poverty |
| Immigrants | Pakistan | 99.3 /100 | #39 | Exceptional 10.8% |
| Russians | 99.3 /100 | #40 | Exceptional 10.9% |
| Immigrants | Iran | 99.2 /100 | #41 | Exceptional 10.9% |
| Koreans | 99.2 /100 | #42 | Exceptional 10.9% |
| Immigrants | Singapore | 99.2 /100 | #43 | Exceptional 10.9% |
| Immigrants | Moldova | 99.1 /100 | #44 | Exceptional 10.9% |
| Turks | 98.9 /100 | #45 | Exceptional 11.0% |
| Immigrants | Czechoslovakia | 98.9 /100 | #46 | Exceptional 11.0% |
| Immigrants | Romania | 98.9 /100 | #47 | Exceptional 11.0% |
| Slovenes | 98.9 /100 | #48 | Exceptional 11.0% |
| Immigrants | Japan | 98.9 /100 | #49 | Exceptional 11.0% |
| Asians | 98.9 /100 | #50 | Exceptional 11.0% |
| Immigrants | Croatia | 98.7 /100 | #51 | Exceptional 11.0% |
| Immigrants | Philippines | 98.7 /100 | #52 | Exceptional 11.0% |
| Immigrants | Austria | 98.6 /100 | #53 | Exceptional 11.1% |
Demographics Similar to Immigrants from Ecuador by Poverty
In terms of poverty, the demographic groups most similar to Immigrants from Ecuador are Mexican American Indian (14.3%, a difference of 0.020%), Trinidadian and Tobagonian (14.3%, a difference of 0.060%), Ottawa (14.3%, a difference of 0.070%), Immigrants from El Salvador (14.3%, a difference of 0.10%), and Immigrants from Nicaragua (14.3%, a difference of 0.34%).
| Demographics | Rating | Rank | Poverty |
| Immigrants | Western Africa | 0.2 /100 | #248 | Tragic 14.1% |
| Immigrants | Ghana | 0.2 /100 | #249 | Tragic 14.2% |
| Cree | 0.2 /100 | #250 | Tragic 14.2% |
| Immigrants | Burma/Myanmar | 0.2 /100 | #251 | Tragic 14.2% |
| Spanish American Indians | 0.2 /100 | #252 | Tragic 14.2% |
| Immigrants | Trinidad and Tobago | 0.2 /100 | #253 | Tragic 14.2% |
| Immigrants | El Salvador | 0.1 /100 | #254 | Tragic 14.3% |
| Immigrants | Ecuador | 0.1 /100 | #255 | Tragic 14.3% |
| Mexican American Indians | 0.1 /100 | #256 | Tragic 14.3% |
| Trinidadians and Tobagonians | 0.1 /100 | #257 | Tragic 14.3% |
| Ottawa | 0.1 /100 | #258 | Tragic 14.3% |
| Immigrants | Nicaragua | 0.1 /100 | #259 | Tragic 14.3% |
| Cape Verdeans | 0.1 /100 | #260 | Tragic 14.4% |
| Cherokee | 0.1 /100 | #261 | Tragic 14.4% |
| Immigrants | Liberia | 0.1 /100 | #262 | Tragic 14.4% |