Cambodian vs Cape Verdean Married-Couple Family Poverty
COMPARE
Cambodian
Cape Verdean
Married-Couple Family Poverty
Married-Couple Family Poverty Comparison
Cambodians
Cape Verdeans
4.5%
MARRIED-COUPLE FAMILY POVERTY
99.2/ 100
METRIC RATING
75th/ 347
METRIC RANK
5.3%
MARRIED-COUPLE FAMILY POVERTY
30.7/ 100
METRIC RATING
192nd/ 347
METRIC RANK
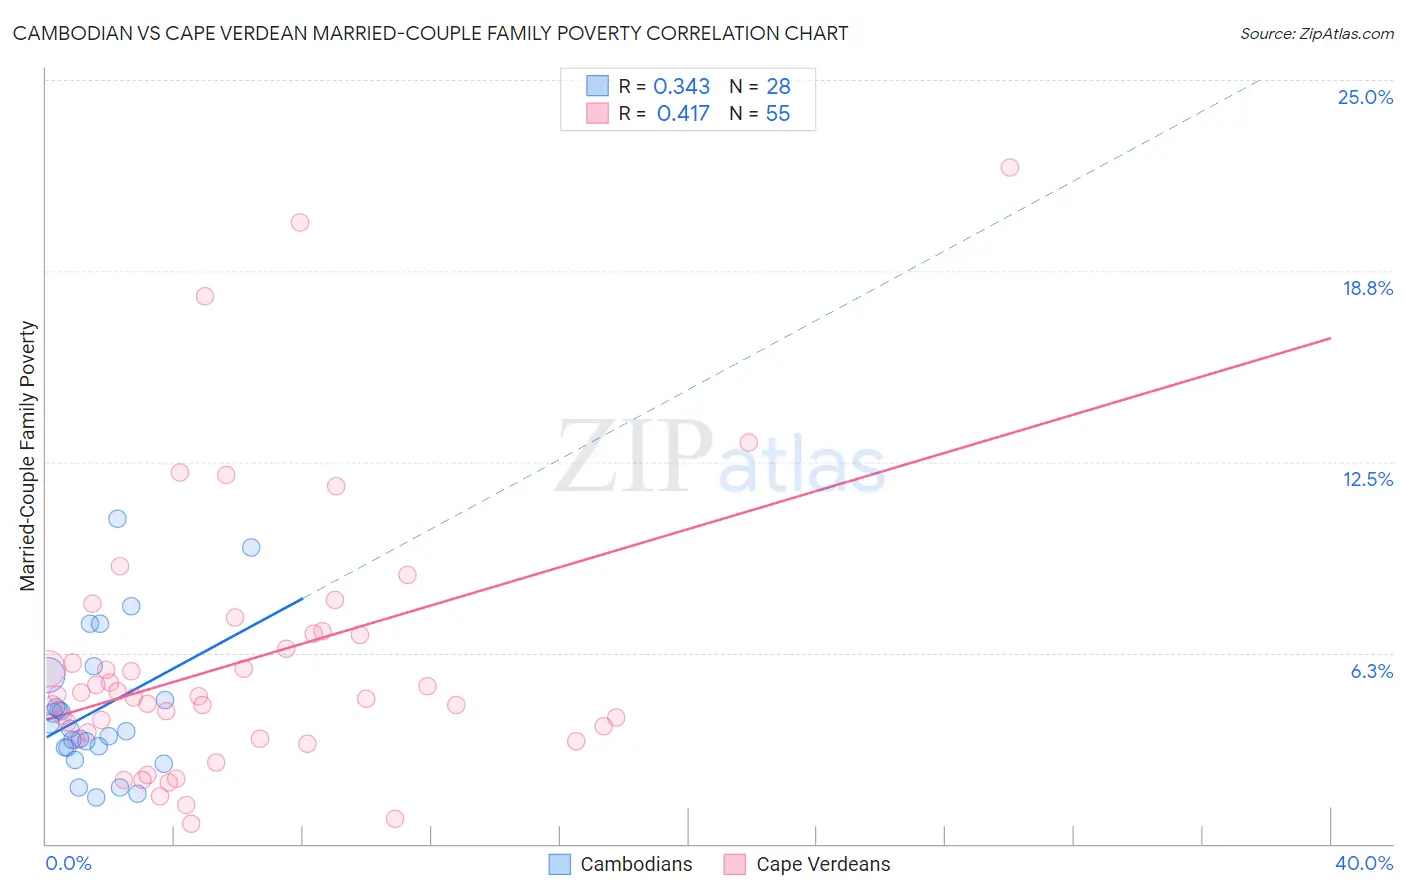
Cambodian vs Cape Verdean Married-Couple Family Poverty Correlation Chart
The statistical analysis conducted on geographies consisting of 102,246,579 people shows a mild positive correlation between the proportion of Cambodians and poverty level among married-couple families in the United States with a correlation coefficient (R) of 0.343 and weighted average of 4.5%. Similarly, the statistical analysis conducted on geographies consisting of 107,147,993 people shows a moderate positive correlation between the proportion of Cape Verdeans and poverty level among married-couple families in the United States with a correlation coefficient (R) of 0.417 and weighted average of 5.3%, a difference of 18.8%.
Married-Couple Family Poverty Correlation Summary
| Measurement | Cambodian | Cape Verdean |
| Minimum | 1.5% | 0.66% |
| Maximum | 10.6% | 22.2% |
| Range | 9.1% | 21.5% |
| Mean | 4.4% | 6.0% |
| Median | 3.7% | 4.8% |
| Interquartile 25% (IQ1) | 3.2% | 3.4% |
| Interquartile 75% (IQ3) | 5.1% | 6.9% |
| Interquartile Range (IQR) | 1.9% | 3.4% |
| Standard Deviation (Sample) | 2.3% | 4.4% |
| Standard Deviation (Population) | 2.2% | 4.4% |
Similar Demographics by Married-Couple Family Poverty
Demographics Similar to Cambodians by Married-Couple Family Poverty
In terms of married-couple family poverty, the demographic groups most similar to Cambodians are Immigrants from South Africa (4.5%, a difference of 0.11%), Immigrants from Austria (4.5%, a difference of 0.27%), Immigrants from Latvia (4.5%, a difference of 0.28%), Scotch-Irish (4.5%, a difference of 0.36%), and Ukrainian (4.5%, a difference of 0.37%).
| Demographics | Rating | Rank | Married-Couple Family Poverty |
| Slavs | 99.4 /100 | #68 | Exceptional 4.4% |
| New Zealanders | 99.4 /100 | #69 | Exceptional 4.4% |
| Immigrants | Korea | 99.4 /100 | #70 | Exceptional 4.5% |
| Immigrants | North America | 99.3 /100 | #71 | Exceptional 4.5% |
| Immigrants | England | 99.3 /100 | #72 | Exceptional 4.5% |
| Ukrainians | 99.2 /100 | #73 | Exceptional 4.5% |
| Immigrants | Austria | 99.2 /100 | #74 | Exceptional 4.5% |
| Cambodians | 99.2 /100 | #75 | Exceptional 4.5% |
| Immigrants | South Africa | 99.1 /100 | #76 | Exceptional 4.5% |
| Immigrants | Latvia | 99.1 /100 | #77 | Exceptional 4.5% |
| Scotch-Irish | 99.1 /100 | #78 | Exceptional 4.5% |
| Immigrants | Iran | 99.0 /100 | #79 | Exceptional 4.5% |
| Icelanders | 99.0 /100 | #80 | Exceptional 4.5% |
| Immigrants | Greece | 98.9 /100 | #81 | Exceptional 4.5% |
| Canadians | 98.8 /100 | #82 | Exceptional 4.5% |
Demographics Similar to Cape Verdeans by Married-Couple Family Poverty
In terms of married-couple family poverty, the demographic groups most similar to Cape Verdeans are Immigrants from Cabo Verde (5.3%, a difference of 0.030%), Ugandan (5.3%, a difference of 0.12%), Malaysian (5.4%, a difference of 0.17%), South American Indian (5.3%, a difference of 0.23%), and Israeli (5.3%, a difference of 0.32%).
| Demographics | Rating | Rank | Married-Couple Family Poverty |
| Americans | 35.4 /100 | #185 | Fair 5.3% |
| Hungarians | 34.7 /100 | #186 | Fair 5.3% |
| Immigrants | Albania | 33.8 /100 | #187 | Fair 5.3% |
| Israelis | 33.1 /100 | #188 | Fair 5.3% |
| South American Indians | 32.5 /100 | #189 | Fair 5.3% |
| Ugandans | 31.6 /100 | #190 | Fair 5.3% |
| Immigrants | Cabo Verde | 30.9 /100 | #191 | Fair 5.3% |
| Cape Verdeans | 30.7 /100 | #192 | Fair 5.3% |
| Malaysians | 29.5 /100 | #193 | Fair 5.4% |
| Immigrants | Israel | 27.8 /100 | #194 | Fair 5.4% |
| Immigrants | Azores | 27.5 /100 | #195 | Fair 5.4% |
| Spaniards | 27.4 /100 | #196 | Fair 5.4% |
| Liberians | 26.3 /100 | #197 | Fair 5.4% |
| Immigrants | Belarus | 26.2 /100 | #198 | Fair 5.4% |
| Uruguayans | 25.0 /100 | #199 | Fair 5.4% |